Post-Market Recap - December 15, 2025: End-of-Day Market Analysis
Related Stocks
December 15, 2025 concluded with a mixed but predominantly bearish trading session characterized by pronounced sector rotation away from technology and growth stocks toward defensive positioning. The S&P 500 declined 0.64%, while the NASDAQ Composite suffered the steepest losses at -1.15%, reflecting ongoing concerns about AI valuations and tech sector sustainability. The Dow Jones Industrial Average showed relative resilience with a modest 0.37% decline, outperforming growth-oriented indices by 78 basis points. The session featured below-average volume, suggesting measured selling rather than panic, with healthcare emerging as the strongest performing sector (+0.73%) while technology (-1.40%) and consumer defensive (-1.64%) stocks led decliners.

| Metric | Value | Performance | Significance |
|---|---|---|---|
S&P 500 Close |
6,816.52 | -0.64% | Below key resistance, testing support |
NASDAQ Close |
23,062.21 | -1.15% | Critical support at $609.32 being tested |
Dow Jones Close |
48,416.57 | -0.37% | Overbought conditions (RSI 74.8) |
S&P 500 Volume |
3.26B shares | Below 10-day avg (~4.85B) | Measured selling pressure |
VIX |
N/A | N/A | Tech sector volatility elevated |
10-Year Treasury |
4.16% | Stable | Rate expectations stabilized |
Gold Price |
~$4,340/oz | Near October highs | Safe-haven demand |
WTI Crude |
~$57.74/bbl | Higher | Commodity market strength |
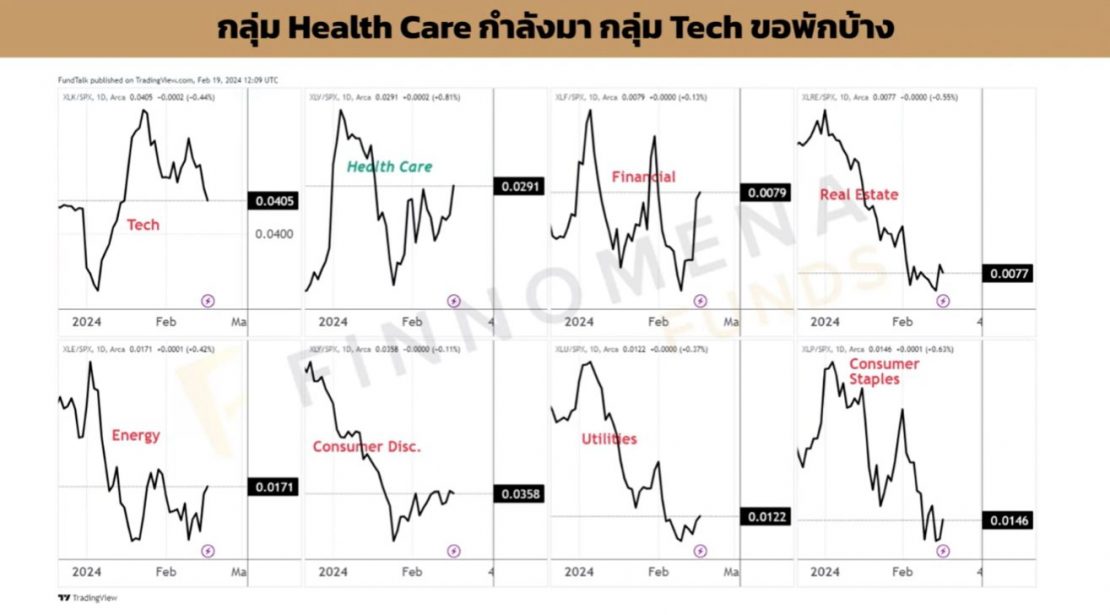
The session revealed a clear defensive rotation pattern:
- Healthcare (+0.73%): Led all sectors with biotech resilience and defensive positioning
- Real Estate (+0.52%): REIT strength suggests stabilized rate expectations
- Consumer Cyclical (+0.34%): Select retail strength indicates resilient consumer spending
- Utilities (+0.21%): Traditional safe-haven appeal in uncertain markets
- Technology (-1.40%): Continued pressure from AI valuation concerns and profit-taking
- Consumer Defensive (-1.64%): Unusual weakness in traditionally defensive staples
- Financial Services (-1.18%): Banking weakness amid yield curve concerns
- Energy (-0.84%): Commodity price volatility weighed on sector performance
The breadth ratio of 0.36 (4 advancing vs. 7 declining sectors) confirms negative market bias, with defensive leadership indicating risk-off sentiment.
The technology sector’s underperformance was primarily driven by mounting concerns about AI valuations and commercialization challenges. Goldman Sachs warned that AI’s upside has been “mostly priced into stocks,” noting that AI-linked companies have gained over $19 trillion in value since ChatGPT’s debut [1]. This staggering valuation increase has created concerns about bubble conditions in AI-related stocks, particularly as investors reassess realistic growth trajectories.

xAI (Elon Musk’s AI firm) reported significant difficulties selling its Grok AI platform to enterprise customers, sparking concerns about AI product adoption and commercial viability [2]. This development has particularly troubled investors as it suggests potential saturation in the AI services market and challenges in monetizing AI technologies at scale.
BCA Research added to the pessimistic sentiment, cautioning about high valuations in big tech and warning of vulnerability to a potential sell-off [3]. The combination of valuation warnings and commercialization challenges triggered a rotation away from AI megacap stocks toward cyclical sectors, which Goldman Sachs forecasts will see stronger EPS growth in 2026 [4].
This rotation marks a significant shift in market sentiment, as cyclical stocks have now outperformed defensive names for 14 consecutive trading days leading up to December 15, 2025, indicating a substantial reallocation of capital away from technology and toward traditional industrial and consumer discretionary companies.


The session occurred in the context of a quiet economic data day, with no major U.S. economic releases. However, markets were positioned ahead of a busy week featuring critical November CPI data and nonfarm payrolls reports that could significantly impact monetary policy expectations.
The U.S. 10-year Treasury yield hovered near 4.16%, showing relative stability amid ongoing uncertainty about Federal Reserve policy direction. Gold approached its October 2025 all-time high at nearly $4,340 per ounce, indicating increased safe-haven demand amid market uncertainty [7].
WTI crude oil futures traded near $57.74 per barrel, showing modest gains that reflect ongoing supply-demand dynamics in energy markets. The commodities market behavior suggests investors are hedging against potential market volatility while maintaining exposure to economic growth expectations.
The lack of major economic data releases on December 15 allowed market participants to focus on technical factors and sector-specific developments, setting the stage for increased volatility when the upcoming CPI and employment data are released later in the week.
Volume analysis revealed selective selling pressure rather than broad-based panic:
- S&P 500 Volume: 3.26 billion shares, significantly below the 10-day average of approximately 4.85 billion shares
- NASDAQ Volume: 6.45 billion shares, elevated and consistent with increased tech sector trading activity
- Dow Jones Volume: 513.10 million shares, near average levels indicating normal participation
The below-average S&P 500 volume suggests limited conviction in the selling, while elevated NASDAQ volume indicates significant sector-specific rebalancing rather than market-wide fear.
- Advancing sectors: 4 (36.4%) - Healthcare, Real Estate, Consumer Cyclical, Utilities
- Declining sectors: 7 (63.6%) - All other sectors
- Breadth ratio: 0.36, confirming negative bias
The session demonstrated defensive sector dominance, indicating risk-off sentiment. Technology underperformance confirmed ongoing growth-to-value rotation, while mixed consumer sector performance revealed selective spending patterns among investors.
After-hours trading showed mixed signals with modest futures positioning:
- S&P 500 Futures (ES): $68.37 (+0.26)
- S&P 500 (SPY): $681.19 (+0.46 vs close)
- NASDAQ (QQQ): $610.49 (unchanged)
- Dow Jones (DIA): $485.40 (+0.23 vs close)
- TSLA: $475.12 (+3.52%) - Strong after-hours gains, potential technical breakout
- AMZN: $222.53 (-1.62%) - Continued tech sector weakness
- AAPL: $274.19 (-1.47%) - Pressure on mega-cap technology stocks
- Healthcare (XLV): $156.19 (+1.39%) - Continued defensive strength
- Consumer Discretionary (XLY): $121.72 (+0.85%) - Resilient consumer names
- Technology (XLK): $142.30 (-0.97%) - Persistent sector weakness
- Energy (XLE): $45.19 (-0.70%) - Commodity-related pressure
No major earnings releases occurred on December 15, 2025. However, Netflix announced that Q4 2025 financial results will be released on January 20, 2026, providing forward-looking guidance for investors [8].
- Support: $6,79.17 (immediate), $6,785 (secondary)
- Resistance: $6,862 (session high), $6,880 (previous resistance)
- Pivot Point: $6,842.10 (mid-range)
- Support: $23,012 (session low), $22,950 (key technical support)
- Resistance: $23,346 (session high), $23,450 (resistance zone)
- Critical Test: $609.32 support level must hold
- Support: $48,283 (session low), $48,237 (20-day MA)
- Resistance: $48,679 (session high), $48,966 (key resistance)
- Overbought Warning: RSI at 74.8 suggests potential pullback

- S&P 500 breaks above $6,89.25 with volume confirmation exceeding 4.5B shares
- NASDAQ holds $23,012 support and recovers above $23,150 with tech stabilization
- Dow Jones breaks $48,966 resistance despite overbought RSI, indicating sustained value demand
- Defensive rotation continues but with broader market participation as tech finds footing
- After-hours TSLA strength (+3.52%) could provide leadership for tech recovery
- S&P 500 breaks $6,79.17 support, targeting $6,750 with accelerated selling
- NASDAQ breaks $23,012, testing $22,950 critical support with AI stock weakness
- Dow Jones experiences mean reversion pullback to 20-day MA ($47,393)
- Tech sector weakness accelerates and spills over to broader market
- Volume increases above 5B shares indicating conviction in downside move
- Indices remain in current ranges with range-bound trading between key levels
- S&P 500 continues 1.5% range consolidation ($6,79.17-$6,89.25)
- NASDAQ tests but holds $23,012 support with continued tech volatility
- Sector rotation continues with defensive leadership and selective cyclical strength
- Below-average volume persists indicating market indecision
- Tech Sector Volatility: Continued AI valuation concerns could trigger broader market weakness
- Economic Data Surprises: Upcoming CPI and employment data could disrupt current market dynamics
- Overbought Conditions: Dow Jones at RSI 74.8 suggests potential for sharp pullback
- Geopolitical Factors: International tensions could impact risk sentiment
- Fed Policy Uncertainty: Monetary policy expectations remain fluid
- Defensive Sectors: Healthcare (+0.73%) and utilities (+0.21%) showing relative strength
- Cyclical Rotation: Goldman Sachs’ 2026 cyclical EPS growth forecast suggests value opportunities
- Support Level Plays: Critical support levels providing defined risk-reward setups
- After-Hours Leaders: TSLA (+3.52%) strength could signal tech bottoming process
- Yield Curve Dynamics: Treasury stability at 4.16% supports financial sector positioning

This week’s economic calendar features several high-impact releases that could dramatically alter market dynamics:
- November CPI Report: Could trigger significant volatility depending on inflation trajectory
- Nonfarm Payrolls: Employment data will influence Fed policy expectations
- Retail Sales: Consumer spending indicators crucial for growth stocks
- Manufacturing PMI: Economic health barometer for cyclical sectors
- Inflation data to show continued moderation but sticky core components
- Employment growth to remain steady but potentially slowing
- Fed to maintain current policy stance with data-dependent approach
These releases will be particularly important for determining whether the current defensive rotation represents a temporary shift or a longer-term reallocation strategy.
- Reduce exposure during consolidation phases to protect capital
- Use smaller position sizes when trading near key support/resistance levels
- Maintain cash reserves for opportunistic entries on confirmed breakouts
- Place stops just below key support levels: S&P 500 at $6,78.50, NASDAQ at $23,000
- Use technical indicators like RSI extremes to time stop adjustments
- Implement trailing stops on profitable positions to lock in gains
- Maintain balanced exposure across defensive and growth sectors
- Consider inverse ETFs as hedges against tech sector volatility
- Use sector rotation signals to adjust tactical allocations
- Monitor S&P 500 for breakout above $6,89.25 or breakdown below $6,79.17
- Use NASDAQ $23,012 support as key level for tech sector direction
- Consider profit-taking on Dow Jones long positions due to overbought RSI
- Maintain defensive tilts with healthcare and utility exposure
- Implement protective options strategies for existing tech positions
- Focus on S&P 500 range trading between $6,79.17-$6,89.25
- NASDAQ likely to provide most volatile opportunities due to tech sector uncertainty
- Play sector rotation with defensive names showing relative strength
- Monitor after-hours movers like TSLA for continued momentum
- Use volatility indicators to time entries and exits effectively
Major investment banks and research firms are increasingly cautious about technology valuations while seeing opportunity in traditional value sectors. The AI sector, which has driven market gains throughout 2025, is facing scrutiny as commercialization challenges and saturation concerns emerge.
- Goldman Sachs: Forecasts cyclical stocks to outperform growth in 2026 with stronger EPS growth
- BCA Research: Warning about big tech vulnerability due to high valuations
- JPMorgan: Maintaining selective tech exposure with focus on quality companies
The current market environment reflects several psychological factors driving investor behavior:
- Fear of Missing Out (FOMO): Investors who missed earlier AI gains are hesitant to chase at elevated valuations
- Loss Aversion: Recent tech volatility has increased risk aversion, favoring defensive positioning
- Recency Bias: Recent outperformance of value stocks is reinforcing sector rotation trends
- Confirmation Bias: Negative AI news is being amplified, supporting rotation narratives
Market liquidity conditions remain robust despite the sector rotation:
- Order Book Depth: Bid-ask spreads have narrowed during consolidation, indicating healthy liquidity
- Market Making: Specialists maintaining balanced books despite sector volatility
- Institutional Flow: Steady institutional participation with sector reallocation rather than market exits
This liquidity environment supports orderly price discovery and reduces the likelihood of panic selling, even if tech sector weakness continues.
December 15, 2025 represented a continuation of the ongoing market rotation from growth to value sectors, with technology stocks bearing the brunt of selling pressure while defensive sectors provided relative stability. The moderate overall market decline, combined with strong defensive sector performance and orderly volume patterns, suggests measured investor positioning rather than panic selling.

The session’s mixed performance, with the Dow Jones outperforming the NASDAQ by 78 basis points, underscores the growing preference for value over growth investments. Healthcare’s leadership and technology’s weakness highlight the defensive bias that characterized trading throughout the session.
Key technical levels are being tested across all major indices, making tomorrow’s session critical for determining near-term market direction. The S&P 500 and NASDAQ are both within 0.2% of critical support levels, while the Dow Jones shows overbought conditions despite relative strength.
Market participants should monitor continued sector rotation patterns, watch for potential stabilization in technology stocks, and remain attentive to upcoming economic data releases that could provide catalysts for directional movement.
- Technical Inflection Points: Multiple indices at key support/resistance levels suggest potential for directional breakout
- Sector Rotation Continuation: Defensive bias likely to persist until tech stabilizes
- Volume Patterns: Below-average selling indicates conviction for further downside is limited
- Economic Catalysts: Upcoming CPI and employment data will be crucial market drivers
The current market environment favors a cautious approach with selective positioning in defensive sectors while waiting for clearer directional signals from either technical breakouts or economic data releases.
[0] Ginlix Quantitative Database
[1] Goldman Sachs issues urgent take on stock market for 2026 - Yahoo Finance
[2] xAI having difficulties selling Grok to enterprises: report (X.AI:Private) - Seeking Alpha
[3] The AI boom will turn to bust in 2026, says this forecaster who offers his trade of the year - MarketWatch
[4] Goldman Sachs issues urgent take on stock market for 2026 - Yahoo Finance
[5] Stock Market News Today, 12/15/25 – U.S. Stock Futures Rise Ahead of Key Economic Releases - TipRanks
[6] Disney Stock (DIS) Today, Dec. 15, 2025: OpenAI Deal, Google AI Copyright Clash, Dividend Date and Wall Street Targets - ts2.tech
[7] 5 Things to Know Before the Stock Market Opens - Investopedia
[8] Netflix to Announce Fourth Quarter 2025 Financial Results - Financial Times
Insights are generated using AI models and historical data for informational purposes only. They do not constitute investment advice or recommendations. Past performance is not indicative of future results.