DFLI Stock Technical Analysis and Catalyst Assessment
Unlock More Features
Login to access AI-powered analysis, deep research reports and more advanced features
About us: Ginlix AI is the AI Investment Copilot powered by real data, bridging advanced AI with professional financial databases to provide verifiable, truth-based answers. Please use the chat box below to ask any financial question.
Related Stocks
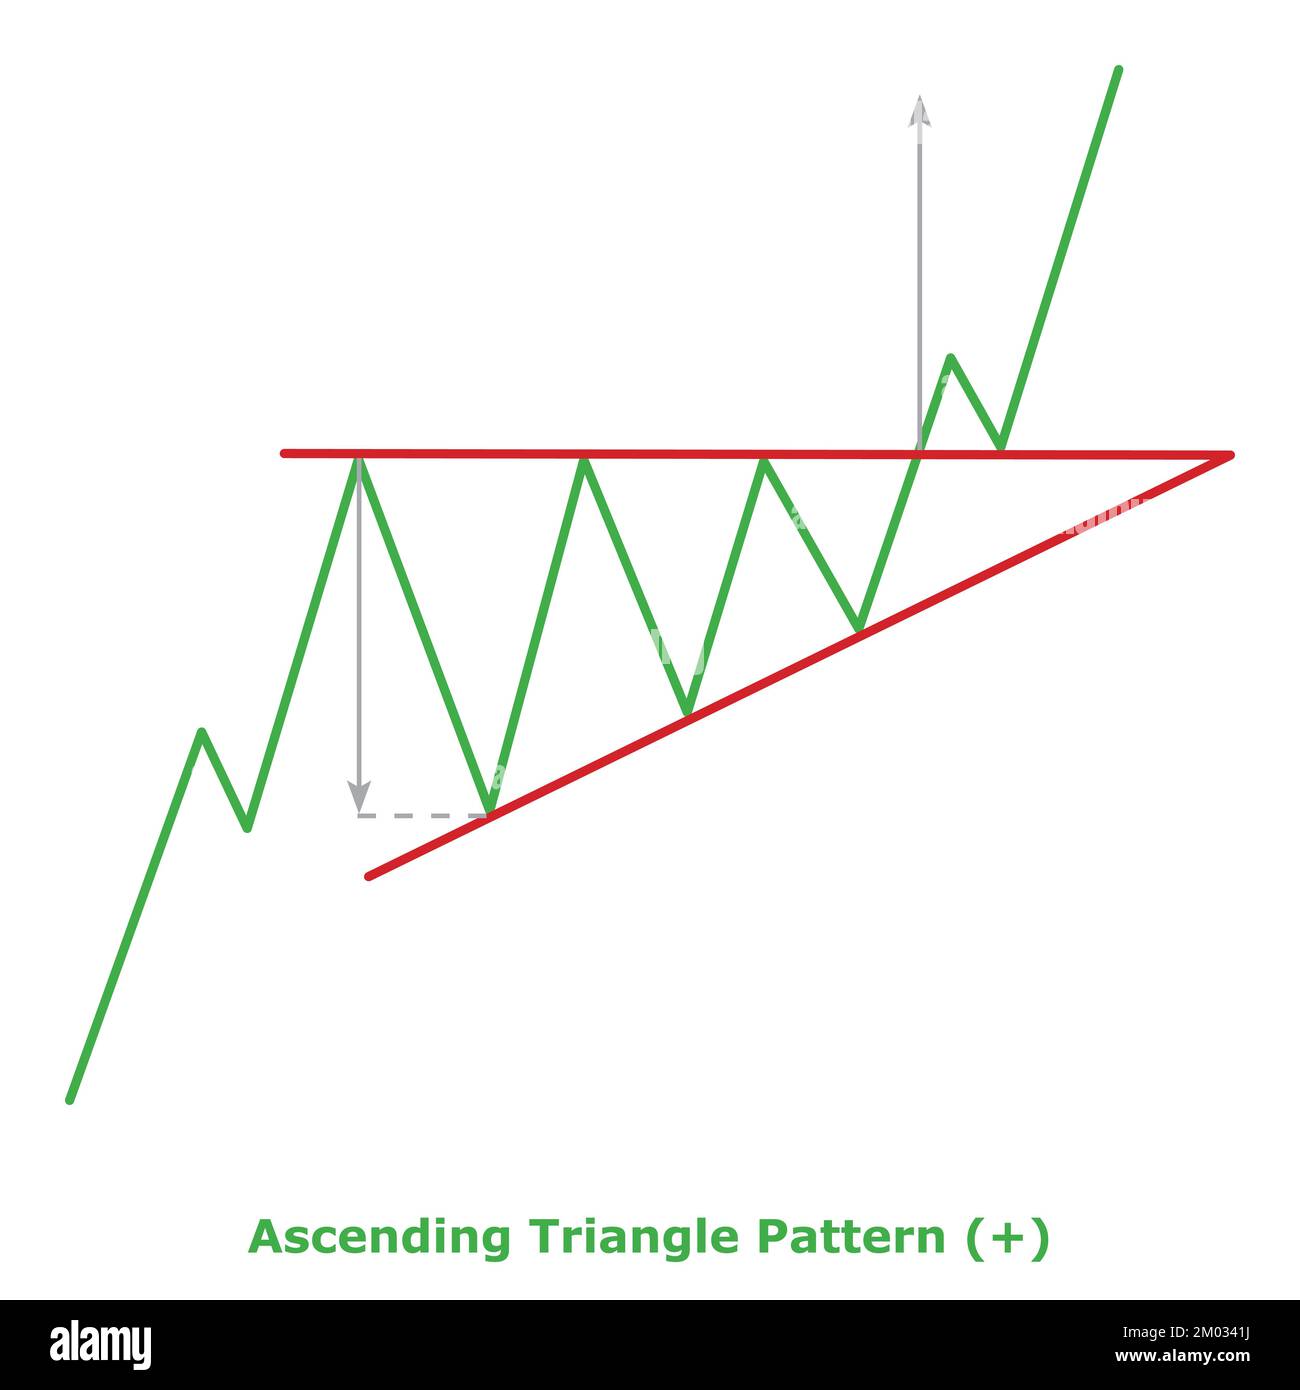
The Reddit discussion on DFLI focuses on technical patterns: an ascending triangle (bullish) on the daily chart and a falling wedge (bullish reversal) on the weekly chart [1]. Key resistance is identified at $0.83-$0.85, with the stock closing at $0.82 on high volume (nearly 30M shares) [0]. The retail deal post-testing is cited as a potential catalyst [0]. However, dilution risks start at $1.35, suggesting profit-taking at $1.37 as a safe strategy [0].
- Technical-Catalyst Alignment: The bullish technical patterns align with the retail deal catalyst, indicating potential upside if resistance is broken.
- Volume-Sentiment Correlation: High volume (30M shares) supports buying interest, reinforcing the bullish narrative [0].
- Risk-Reward Balance: Dilution risks at higher levels ($1.35+) necessitate cautious profit-taking strategies [0].
- Resistance Hurdle: Immediate resistance at $0.83-$0.85 may limit short-term gains [1].
- Dilution Risk: Past dilution at $1.35 suggests potential selling pressure at higher levels [0].
- Pattern Failure: Ascending triangles have a 17-36% failure rate due to low volume or negative catalysts [1].
- Catalyst Upside: The retail deal post-testing could drive further buying interest [0].
- Technical Breakout: A break above $0.85 may trigger a sustained bullish move [1].
DFLI exhibits bullish technical patterns (ascending triangle, falling wedge) with high volume (30M shares) and a retail deal catalyst. Resistance at $0.83-$0.85 and dilution risks at $1.35+ are critical factors. The stock closed at $0.82, showing mixed signals with potential upside balanced by cautious points.
Insights are generated using AI models and historical data for informational purposes only. They do not constitute investment advice or recommendations. Past performance is not indicative of future results.
About us: Ginlix AI is the AI Investment Copilot powered by real data, bridging advanced AI with professional financial databases to provide verifiable, truth-based answers. Please use the chat box below to ask any financial question.