Market Bubble Analysis: AI Hype Masks Economic Weakness in Classic Price Bubble
Unlock More Features
Login to access AI-powered analysis, deep research reports and more advanced features
About us: Ginlix AI is the AI Investment Copilot powered by real data, bridging advanced AI with professional financial databases to provide verifiable, truth-based answers. Please use the chat box below to ask any financial question.
Related Stocks
This analysis is based on the Seeking Alpha article [1] published on November 4, 2025, which reported economist David Rosenberg’s warning that the U.S. stock market is experiencing a “classic price bubble” built on fragile foundations.
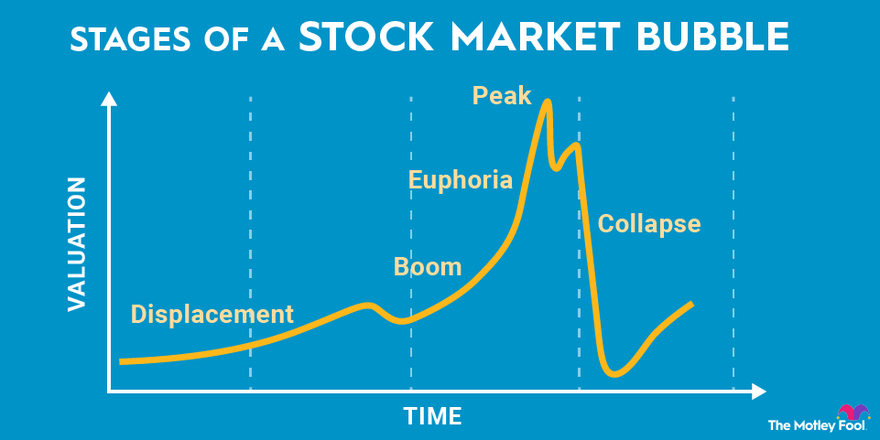
The current market environment presents a stark divergence between asset prices and underlying economic reality. While major indices have shown resilience over the past 30 days, with the NASDAQ Composite gaining +3.50% and S&P 500 up +1.65% [0], this performance masks significant structural weaknesses. Rosenberg, who accurately predicted both the 2000 tech bust and 2008 financial crisis, identifies the current situation as a “gigantic price bubble” where “prices move up in the face of negative fundamentals” [3].
The market rally is heavily concentrated in AI-related stocks, creating dangerous market bifurcation. Recent performance shows Nvidia rising 2.2% in a single day (bringing year-to-date gains to 54.1%), Amazon gaining 4% after announcing a $38 billion OpenAI agreement, and Palantir Technologies up 3.3% with stunning 165% year-to-date gains [4]. However, as PBS News reported, “More gains for Nvidia, Amazon and other AI superstars propped up Wall Street on Monday. The S&P 500 rose 0.2% and pulled closer to its all-time high set last week, even though the majority of stocks in the index sank” [4].
Current market valuations have reached historically dangerous levels. The Shiller CAPE Ratio stands at 37.5, representing the third-highest level in history, trailing only peaks in 2021 and 2022 [3]. Historical analysis reveals that when the CAPE ratio exceeds 35, forward returns have been negative every time in history [3]. Bank of America data indicates that starting valuations can explain approximately 80% of market performance over the subsequent 10-year period [3], suggesting significant downside risk.
Beyond the CAPE ratio, sector performance reveals underlying weakness across most economic segments. Technology (-0.14%), Financial Services (-0.46%), Industrials (-0.53%), Real Estate (-0.68%), and Utilities (-0.58%) all declined, with only defensive sectors like Energy (+0.44%) and Healthcare (+0.26%) showing positive performance [0]. This defensive rotation indicates growing investor caution despite the headline index gains.
The economic fundamentals supporting the market rally are rapidly deteriorating. Job growth has fallen below 100,000 per month over the past four months, while the economy added 911,000 fewer jobs than previously thought through March 2025 [3]. Manufacturing activity has contracted more than expected, with manufacturers citing tariff-related financial pain [4].
The labor market deterioration is particularly concerning given historical patterns. Initial jobless claims above 240,000 have historically triggered negative payroll growth [3], creating a potential cascade effect on consumer spending and corporate earnings. This economic weakness occurs despite record liquidity conditions that may be artificially inflating asset prices.
The current market structure represents an unprecedented concentration of risk in AI-related stocks. While AI innovation represents genuine technological progress, the current investment frenzy exhibits classic bubble characteristics. The market’s dependence on a narrow cohort of AI stocks creates systemic vulnerability, as demonstrated by the Russell 2000’s -0.77% decline over the past 30 days [0], indicating small-cap underperformance and broader market weakness.
Record liquidity conditions are creating significant price distortions across asset classes. While the article mentions “record liquidity” as a bubble driver [1], specific monetary policy data would provide additional context. The combination of abundant liquidity and extreme valuations creates conditions where price discovery mechanisms become impaired, potentially leading to sharp corrections when liquidity conditions normalize.
Rosenberg’s analysis draws important parallels to previous market bubbles. The current environment shares key characteristics with the 2000 tech bubble (sector concentration, extreme valuations) and 2008 financial crisis (liquidity-driven price inflation, deteriorating fundamentals). His successful track record in predicting these previous crises lends credibility to current warnings, particularly given the consistent historical pattern of bubbles ending in sharp corrections when fundamentals reassert themselves.
The analysis reveals several elevated risk factors that warrant careful attention:
-
Valuation Risk: The third-highest CAPE ratio in history has consistently preceded negative returns [3]. Current valuations suggest significant downside potential over medium to long-term horizons.
-
Economic Deterioration: Rising unemployment claims and weak manufacturing data indicate increasing recession risks [3][4]. The labor market weakening could trigger a negative feedback loop affecting corporate earnings and consumer spending.
-
Market Concentration Risk: Heavy reliance on AI stocks creates vulnerability if the trade reverses or if these stocks fail to meet elevated expectations. The Russell 2000’s underperformance [0] suggests this risk is already materializing.
-
Liquidity Dependency: The market’s dependence on record liquidity creates exposure to policy changes or monetary tightening that could expose underlying fragilities.
Decision-makers should track several key indicators for early warning signals:
- Labor Market Metrics: Initial jobless claims above 240,000 historically precede negative payroll growth [3]
- AI Earnings Results: Upcoming quarterly reports from AI leaders will test current valuation assumptions
- Tariff Impact Assessment: Manufacturing sentiment indicates trade policies are creating economic headwinds [4]
- Liquidity Condition Changes: Any tightening of monetary policy could trigger market corrections
The combination of extreme valuations, deteriorating economic fundamentals, and euphoric market sentiment creates conditions that have historically preceded significant market corrections. Users should be aware that these risk factors may significantly impact portfolio values, particularly in high-valuation growth stocks and AI-related investments.
The U.S. stock market currently exhibits classic bubble characteristics, with AI hype and record liquidity masking deep economic weakness. While major indices show resilience, this performance is driven by narrow AI stock leadership that masks broader market deterioration. The Shiller CAPE Ratio at 37.5 represents the third-highest valuation level in history, with historical precedent suggesting negative returns ahead [3]. Economic fundamentals are deteriorating, with weak job growth, manufacturing contraction, and rising recession risks [3][4]. The market’s heavy concentration in AI stocks creates systemic vulnerability, while defensive sector rotation indicates growing investor caution [0]. These factors combine to create significant downside risk, particularly if liquidity conditions normalize or economic weakness accelerates.
Insights are generated using AI models and historical data for informational purposes only. They do not constitute investment advice or recommendations. Past performance is not indicative of future results.
About us: Ginlix AI is the AI Investment Copilot powered by real data, bridging advanced AI with professional financial databases to provide verifiable, truth-based answers. Please use the chat box below to ask any financial question.