Dow Falls 226 Points as Fear and Greed Index Enters Fear Zone Amid Market Rotation
Unlock More Features
Login to access AI-powered analysis, deep research reports and more advanced features
About us: Ginlix AI is the AI Investment Copilot powered by real data, bridging advanced AI with professional financial databases to provide verifiable, truth-based answers. Please use the chat box below to ask any financial question.
Related Stocks
This analysis is based on the Benzinga report [1] published on November 4, 2025, which detailed the Dow’s decline and the Fear and Greed Index movement into the “Fear” zone.
The market exhibited significant fragmentation on November 4, 2025, with the Dow Jones Industrial Average suffering the steepest decline among major indices, falling 226 points to close at 47,336.68 [1]. This contrasts sharply with the S&P 500’s modest gain of 0.17% to 6,851.97 and the Nasdaq Composite’s stronger advance of 0.46% to 23,834.72 [1]. The divergence suggests sector-specific rotation rather than broad-based market weakness, with investors selectively maintaining confidence in technology-heavy segments while reducing exposure to traditional industrial components.
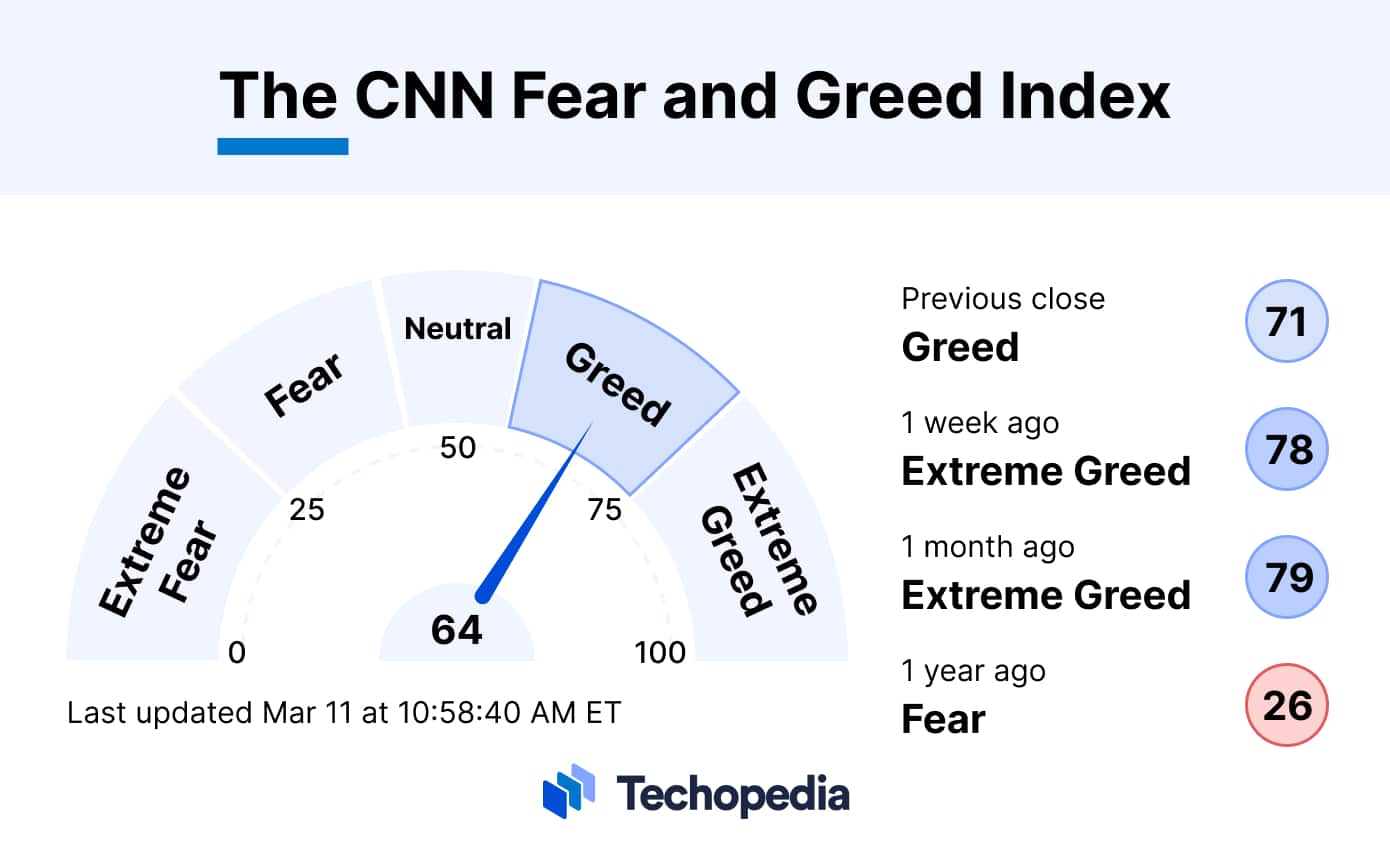
The CNN Money Fear and Greed Index declined to 44.2, moving into the “Fear” zone from a previous reading of 48.5 [1]. This 4.3-point drop indicates accelerating investor concern, though the level remains in elevated fear rather than extreme panic territory. The rapid decline suggests growing market anxiety, potentially influenced by multiple factors including economic data and political uncertainty.
Analysis of sector performance reveals a classic flight-to-safety pattern [0]:
- Defensive sectors outperformed: Consumer Defensive (+1.39%), Healthcare (+0.43%)
- Cyclical sectors suffered: Communication Services (-2.97%), Basic Materials (-2.05%), Technology (-0.74%)
This rotation pattern typically emerges during periods of increased market uncertainty and reflects investors’ preference for sectors with more stable earnings and dividends during volatile conditions.
The ISM manufacturing PMI declined to 48.7 in October from 49.1 in September, missing market estimates of 49.5 [1]. This contraction in manufacturing activity likely contributed significantly to the negative sentiment, particularly affecting industrial and material stocks that comprise substantial portions of the Dow Jones Industrial Average.
Despite the overall market concern, several technology leaders demonstrated remarkable strength. NVIDIA Corp. (NVDA) jumped 2.2%, while Amazon.com Inc. (AMZN) climbed 4% following Friday’s 9.6% rally, marking its strongest two-day performance since November 2022 [1]. This outperformance suggests continued investor appetite for large-cap technology leaders with strong fundamentals, even during periods of broader market anxiety.
The Dow’s decline was accompanied by significant trading volume, with 571,740,460 shares traded [0], indicating active investor participation and conviction behind the selling pressure. High volume during declines typically reinforces the significance of the price movement and suggests genuine investor concern rather than temporary technical factors.
The current decline occurs against a backdrop of recent strong performance, with October showing gains of S&P 500 (+2.3%), Dow (+2.5%), and Nasdaq (+4.7%) [1]. This context suggests the current fear levels may represent a consolidation phase following recent gains rather than the beginning of a sustained downturn.
-
Manufacturing Contraction: The ISM PMI reading below 50 indicates manufacturing contraction, which if sustained could signal broader economic weakness and further depress investor sentiment [1].
-
Government Shutdown Impact: Ongoing government shutdown concerns, particularly with Thanksgiving approaching, could create additional economic uncertainty and market volatility [2].
-
Sector Rotation Volatility: The sharp divergence between defensive and cyclical sectors indicates potential market instability and rapid capital flows that could create short-term volatility.
Decision-makers should closely watch:
- Fear and Greed Index trajectory for stabilization or further decline
- Subsequent PMI readings to determine if October’s contraction is anomalous or trend-setting
- Federal Reserve communications for policy signals addressing market concerns
- Upcoming corporate earnings results that could reinforce or alleviate current sentiment
Based on historical patterns, Fear and Greed Index readings in the 40s typically indicate elevated but not extreme fear levels [1]. However, the rapid decline from 48.5 to 44.2 suggests accelerating concern that warrants careful monitoring for potential trend changes.
The market data reveals a complex picture of selective risk aversion rather than broad-based panic. While the Dow’s 226-point decline and the Fear and Greed Index’s movement to 44.2 indicate genuine investor concern [1], the resilience of technology mega-caps and the outperformance of defensive sectors suggest measured portfolio rebalancing rather than indiscriminate selling. The manufacturing PMI contraction provides fundamental justification for increased caution, though the market’s overall context following strong October gains suggests this may represent a consolidation phase [0][1]. The high trading volume accompanying the decline reinforces the significance of the sentiment shift, while the sector rotation patterns provide clear evidence of risk-off positioning strategies being implemented by institutional investors.
Insights are generated using AI models and historical data for informational purposes only. They do not constitute investment advice or recommendations. Past performance is not indicative of future results.
About us: Ginlix AI is the AI Investment Copilot powered by real data, bridging advanced AI with professional financial databases to provide verifiable, truth-based answers. Please use the chat box below to ask any financial question.