S&P 500 Rule of 20 Analysis: Extreme Overvaluation Warning at 34.73
Unlock More Features
Login to access AI-powered analysis, deep research reports and more advanced features
About us: Ginlix AI is the AI Investment Copilot powered by real data, bridging advanced AI with professional financial databases to provide verifiable, truth-based answers. Please use the chat box below to ask any financial question.
Related Stocks
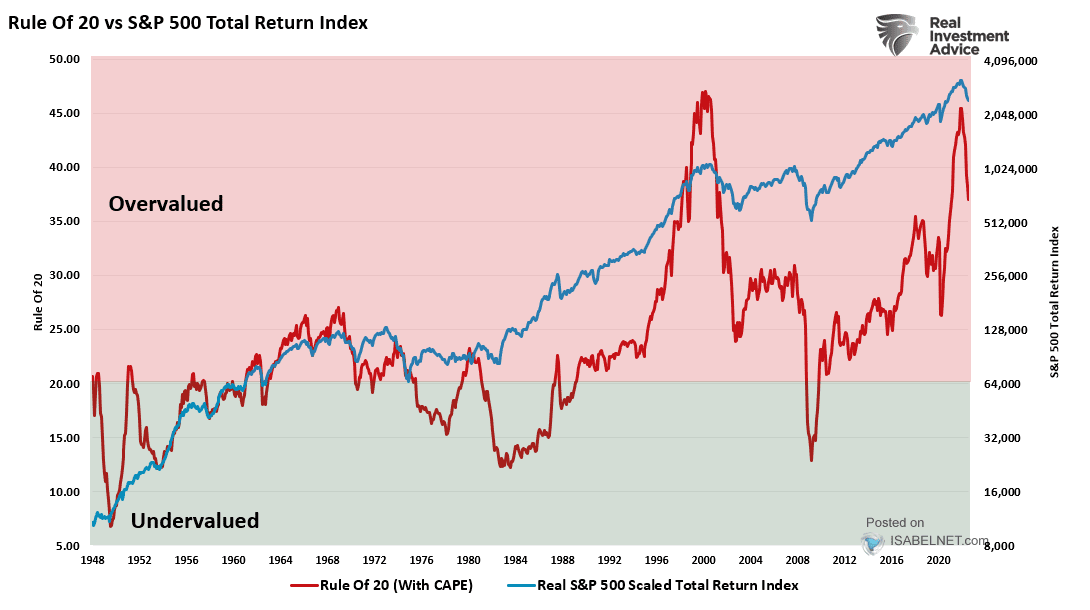
This analysis is based on the Seeking Alpha report [1] published on November 3, 2025, which warns that the S&P 500’s Rule of 20 (R20) metric has reached 34.73, signaling extreme overvaluation and bubble-like conditions versus historical norms. The Rule of 20 combines the S&P 500 forward P/E ratio with year-over-year CPI changes, with stocks considered fairly valued at 20, inexpensive below 20, and expensive above 20 [3].
Despite the concerning valuation signal, major U.S. indices have shown recent strength [0]:
- S&P 500: +2.45% over 30 days, closing at 6,856.35
- NASDAQ Composite: +4.78%, reaching 23,871.71
- Dow Jones Industrial: +2.23% to 47,396.73
However, underlying market structure reveals significant concerns. Roth Capital Partners has identified growing cracks in market breadth, noting that while the S&P 500 gained 2.3% in October and 0.7% last week, its equal-weight counterpart moved in the opposite direction [2]. This divergence suggests fragile market leadership driven primarily by large-cap stocks.
Current sector analysis shows defensive sectors maintaining relative strength while growth-oriented sectors face pressure [0]:
- Consumer Cyclical: +0.22%
- Consumer Defensive: +0.21%
- Energy: +0.01%
- Communication Services: -3.84%
- Basic Materials: -1.85%
- Industrials: -0.99%
- Financial Services: -0.96%
At 34.73, the current R20 reading suggests the market is approximately 74% overvalued relative to the fair value benchmark of 20. According to the Seeking Alpha analysis, higher R20 values historically correlate with lower future returns and increased risk of market losses, particularly at current elevated levels [1].
The divergence between cap-weighted and equal-weighted indices is particularly troubling. When large-cap stocks drive market gains while the broader market struggles, it often indicates narrowing market participation and increased vulnerability to sharp corrections [2].
The outperformance of defensive sectors alongside weakness in growth-oriented areas suggests investors are increasingly positioning for potential market turbulence, consistent with the elevated valuation warning.
Key risk monitoring points include:
- Market Breadth Indicators: Continued divergence between cap-weighted and equal-weighted indices [2]
- Sector Rotation: Whether defensive sectors maintain their relative outperformance [0]
- Valuation Metrics: Whether R20 levels continue to rise or begin to normalize
- Earnings Quality: Whether earnings growth can justify current valuations
- Interest Rate Environment: Monetary policy changes affecting both P/E ratios and inflation components
The Seeking Alpha analysis suggests that midcap and small-cap stocks, as well as energy and telecom sectors, may offer more attractive valuations and downside protection compared to large caps [1]. Additionally, dynamic allocation to fixed income based on R20 levels could provide portfolio resilience.
The Rule of 20 metric at 34.73 indicates extreme market overvaluation, approximately 74% above fair value benchmarks. While major indices have shown recent strength, underlying market breadth deterioration and sector rotation patterns suggest increasing fragility. Historical correlations between elevated R20 levels and subsequent market corrections warrant careful monitoring. The analysis suggests considering portfolio adjustments toward midcap/small-cap stocks and defensive sectors, with expectations of below-average returns in 2026 and rising volatility through 2029 [1].
Critical information gaps include the specific breakdown of R20 components (P/E ratio vs. inflation), detailed historical performance at similar valuation levels, international market comparisons, and earnings growth sustainability analysis. Decision-makers should seek this additional context to fully assess the implications of the current valuation extremes.
Insights are generated using AI models and historical data for informational purposes only. They do not constitute investment advice or recommendations. Past performance is not indicative of future results.
About us: Ginlix AI is the AI Investment Copilot powered by real data, bridging advanced AI with professional financial databases to provide verifiable, truth-based answers. Please use the chat box below to ask any financial question.