SPY Double Top Pattern Analysis (2025-11-19): Potential Bearish Signal & Market Impact
Unlock More Features
Login to access AI-powered analysis, deep research reports and more advanced features
About us: Ginlix AI is the AI Investment Copilot powered by real data, bridging advanced AI with professional financial databases to provide verifiable, truth-based answers. Please use the chat box below to ask any financial question.
Related Stocks
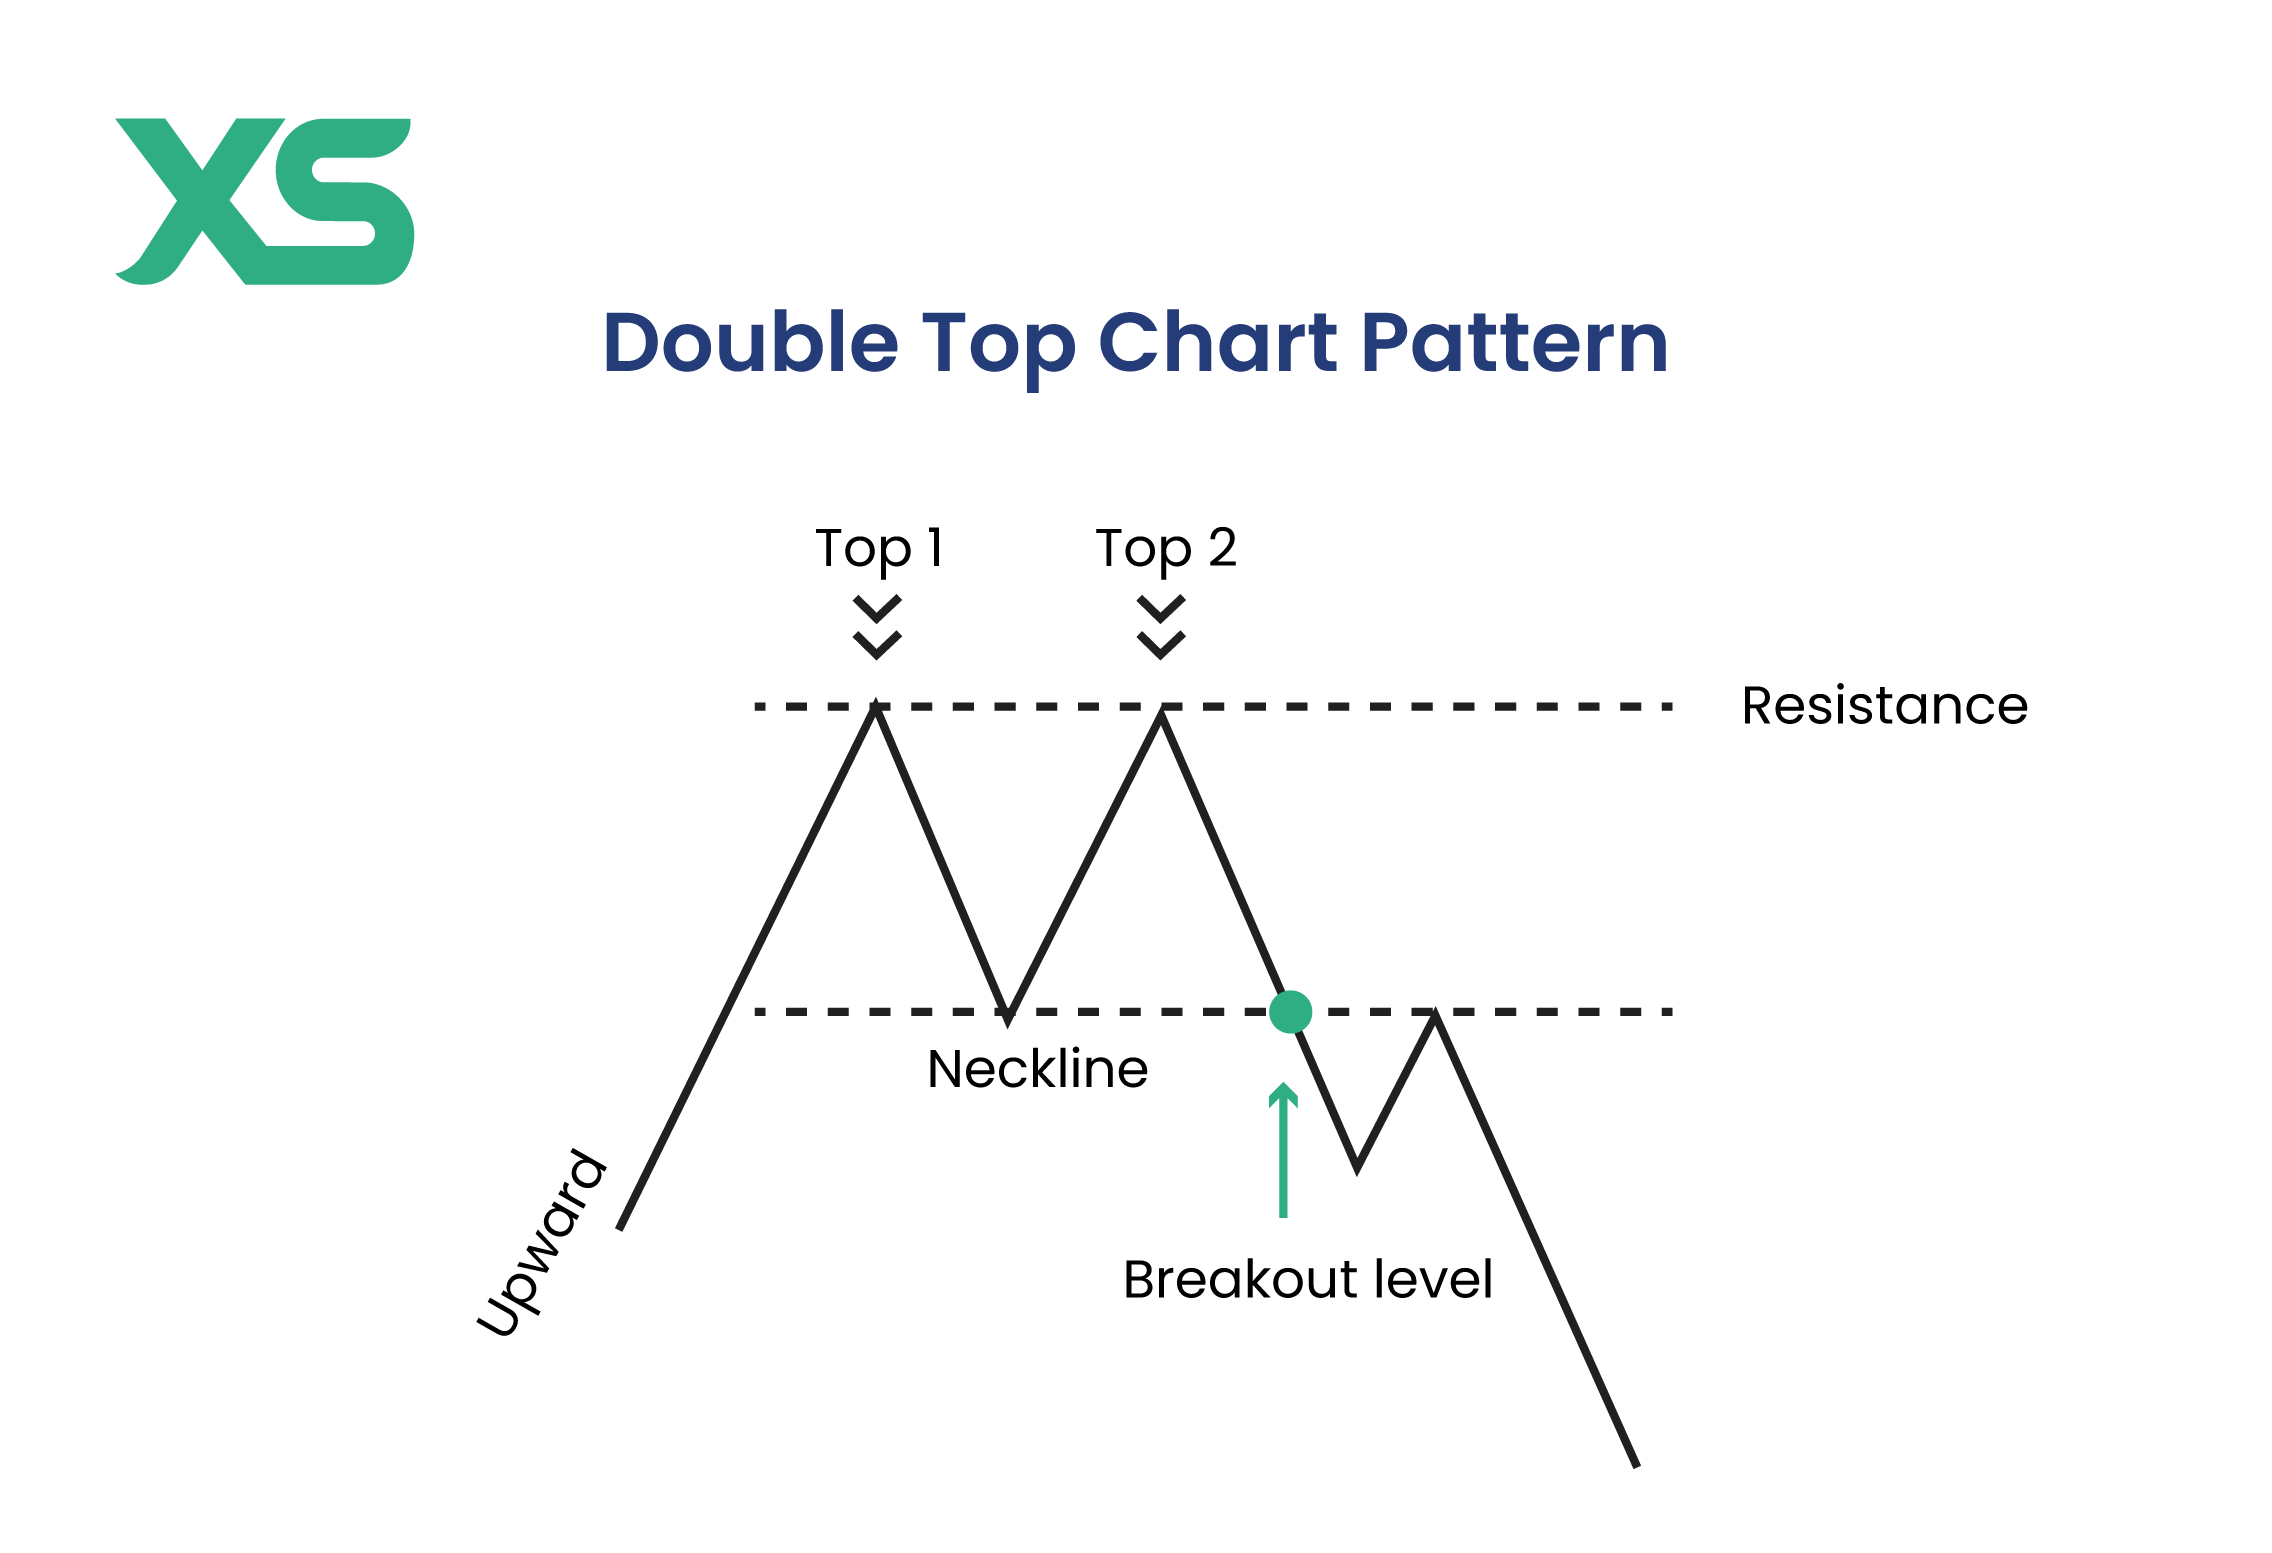
On November 19, 2025, a Reddit user posted a point-and-figure chart suggesting the SPDR S&P 500 ETF (SPY) may have formed a double top pattern, a bearish reversal indicator [3]. This post coincided with SPY closing down 0.84% at $660.08 with above-average volume (107.21M shares, 141% of the 75.98M average) [2]. Over the past 30 days, SPY has declined 1.52% and is now trading below its 20-day moving average ($660.08 vs. $676.67), a bearish technical signal if sustained [0]. A study on social media impact found that sentiment can have permanent price effects on SPY, indicating this discussion may influence future trading [1].
- The potential double top pattern (peaks at ~$689.70 and $687.39) requires confirmation via a break below the estimated neckline ($652.84) to validate bearish signals.
- Mixed sentiment: Reddit users expressed skepticism, but technical data shows increased selling pressure and volatility.
- SPY’s position below the 20-day MA adds to bearish technical context if sustained.
- Risks: False signal risk (double tops have ~60% success rate), potential downside to ~$615 if confirmed, volatility from whipsaw movements.
- Opportunities: Monitor for confirmation (break below neckline) to inform risk management; no immediate upside opportunities identified from current data.
- SPY 30-day change: -1.52% [0]; Nov19 close: $660.08 (-0.84%) [2]; 20-day MA: $676.67 [0]; 52-week high: $689.70 [2].
- The pattern remains unconfirmed; investors should monitor neckline support ($652.84) and volume trends.
Insights are generated using AI models and historical data for informational purposes only. They do not constitute investment advice or recommendations. Past performance is not indicative of future results.
About us: Ginlix AI is the AI Investment Copilot powered by real data, bridging advanced AI with professional financial databases to provide verifiable, truth-based answers. Please use the chat box below to ask any financial question.