SPY vs Individual Stock Performance: Market-Cap Weighted Index Masks Broad Market Weakness
Unlock More Features
Login to access AI-powered analysis, deep research reports and more advanced features
About us: Ginlix AI is the AI Investment Copilot powered by real data, bridging advanced AI with professional financial databases to provide verifiable, truth-based answers. Please use the chat box below to ask any financial question.
Related Stocks
This analysis is based on a Reddit post [1] published on November 13, 2025, at 21:49:52 EST, which argued that citing SPY’s modest decline is misleading due to the index’s heavy skew toward Mag 7 stocks, while most individual stocks have fallen 20-30% over the past three months.
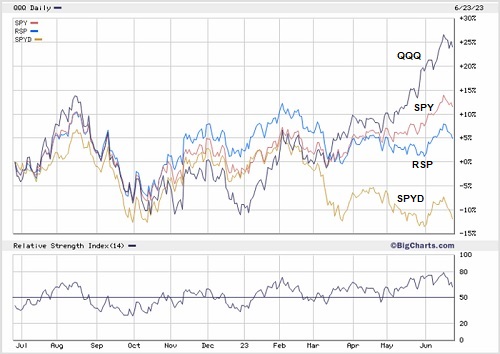
The Reddit user’s concerns are strongly supported by quantitative market data [0]. Over the past three months, SPY (market-cap weighted S&P 500) gained +4.21%, while RSP (equal-weight S&P 500) only gained +1.34% [0]. This 2.87 percentage point performance gap demonstrates that mega-cap stocks are indeed masking weakness in the broader market. The Russell 2000 (IWM) gained +3.74% over the same period [0], indicating small caps have performed better than the average large-cap stock.
The “Magnificent 7” stocks show divergent but overall strong performance that explains SPY’s resilience:
- Strong performers: GOOGL (+36.47%), AAPL (+18.12%), TSLA (+17.71%) [0]
- Moderate performers: AMZN (+7.02%), NVDA (+2.32%) [0]
- Underperformers: MSFT (-5.42%), META (-22.91%) [0]
The top four S&P 500 holdings demonstrate extreme concentration: NVDA (8.06%), MSFT (7.37%), AAPL (5.76%), and AMZN (4.11%) collectively represent over 25% of the index weight [2]. This concentration creates significant systemic risk, as weakness in these few stocks could disproportionately impact the entire index.
S&P Global’s market data confirms deteriorating breadth over recent months [3]:
- October 2025: Only 204 advancing vs 298 declining S&P 500 stocks
- September 2025: 248 advancing vs 255 declining
- August 2025: 337 advancing vs 166 declining
This clear deterioration in market participation indicates that fewer stocks are contributing to market gains, increasing fragility and potential for sharp corrections.
The apparent market health indicated by SPY’s performance masks significant underlying weakness in individual stocks. Most sectors show negative performance: Technology (-1.57%), Consumer Cyclical (-2.87%), Energy (-2.16%), Financial Services (-1.49%), and Utilities (-3.11%) [0]. Only defensive sectors like Consumer Defensive (+0.87%) and Basic Materials (+0.08%) showed positive performance [0].
Younger investors focused on individual stock picking likely experienced portfolio performance diverging significantly from major indices. The high probability of selecting underperforming stocks, combined with the 20-30% declines mentioned in the Reddit post [1], suggests many investors faced substantial losses despite SPY’s resilience.
The widening gap between market-cap and equal-weight performance, combined with deteriorating breadth, indicates increasing systemic risk. If mega-cap leadership falters, the market could experience rapid and severe corrections due to the lack of broad-based support.
- Concentration Risk: Over 25% of S&P 500 weight concentrated in four stocks creates vulnerability to mega-cap underperformance [2]
- Breadth Deterioration: October’s advance/decline ratio of 0.68 indicates weak market participation [3]
- Valuation Concerns: High P/E ratios in mega-caps (NVDA: 53.24x, AAPL: 36.54x) suggest potential overvaluation [0]
- Leadership Dependency: Market gains increasingly dependent on few mega-cap stocks
- RSP vs SPY spread: Watch for acceleration beyond the current 2.87% gap
- Advance/decline ratios: Sustained ratios below 1.0 indicate continued breadth weakness
- Sector rotation: Monitor defensive vs cyclical performance for leadership changes
- Individual stock dispersion: Track percentage of stocks above key moving averages
The current market structure may present opportunities in:
- Equal-weight strategies that benefit from broader market recovery
- Undervalued mid-cap and small-cap stocks not captured by mega-cap dominance
- Defensive sectors showing relative strength
The analysis reveals that SPY’s modest performance significantly misrepresents underlying market conditions. While SPY gained +4.21% over three months [0], the equal-weight RSP only gained +1.34% [0], and most individual stocks declined 20-30% according to the Reddit user [1]. Market breadth has deteriorated significantly, with October showing only 204 advancing vs 298 declining S&P 500 stocks [3]. The market’s heavy reliance on mega-cap stocks, particularly NVDA, MSFT, AAPL, and AMZN which comprise over 25% of the index [2], creates substantial concentration risk. Most sectors show negative performance, with only defensive sectors providing positive returns [0]. This divergence between index performance and individual stock reality suggests investors should exercise caution and consider the implications of market concentration and breadth deterioration in their decision-making process.
Insights are generated using AI models and historical data for informational purposes only. They do not constitute investment advice or recommendations. Past performance is not indicative of future results.
About us: Ginlix AI is the AI Investment Copilot powered by real data, bridging advanced AI with professional financial databases to provide verifiable, truth-based answers. Please use the chat box below to ask any financial question.