US Stock Market Rally Analysis: Record Mid-Year Gains Since 1950 and Year-End Risk Assessment
Unlock More Features
Login to access AI-powered analysis, deep research reports and more advanced features
About us: Ginlix AI is the AI Investment Copilot powered by real data, bridging advanced AI with professional financial databases to provide verifiable, truth-based answers. Please use the chat box below to ask any financial question.
Related Stocks
This analysis is based on the MarketWatch report [1] published on November 1, 2025, which highlighted the unprecedented nature of the current stock market rally.
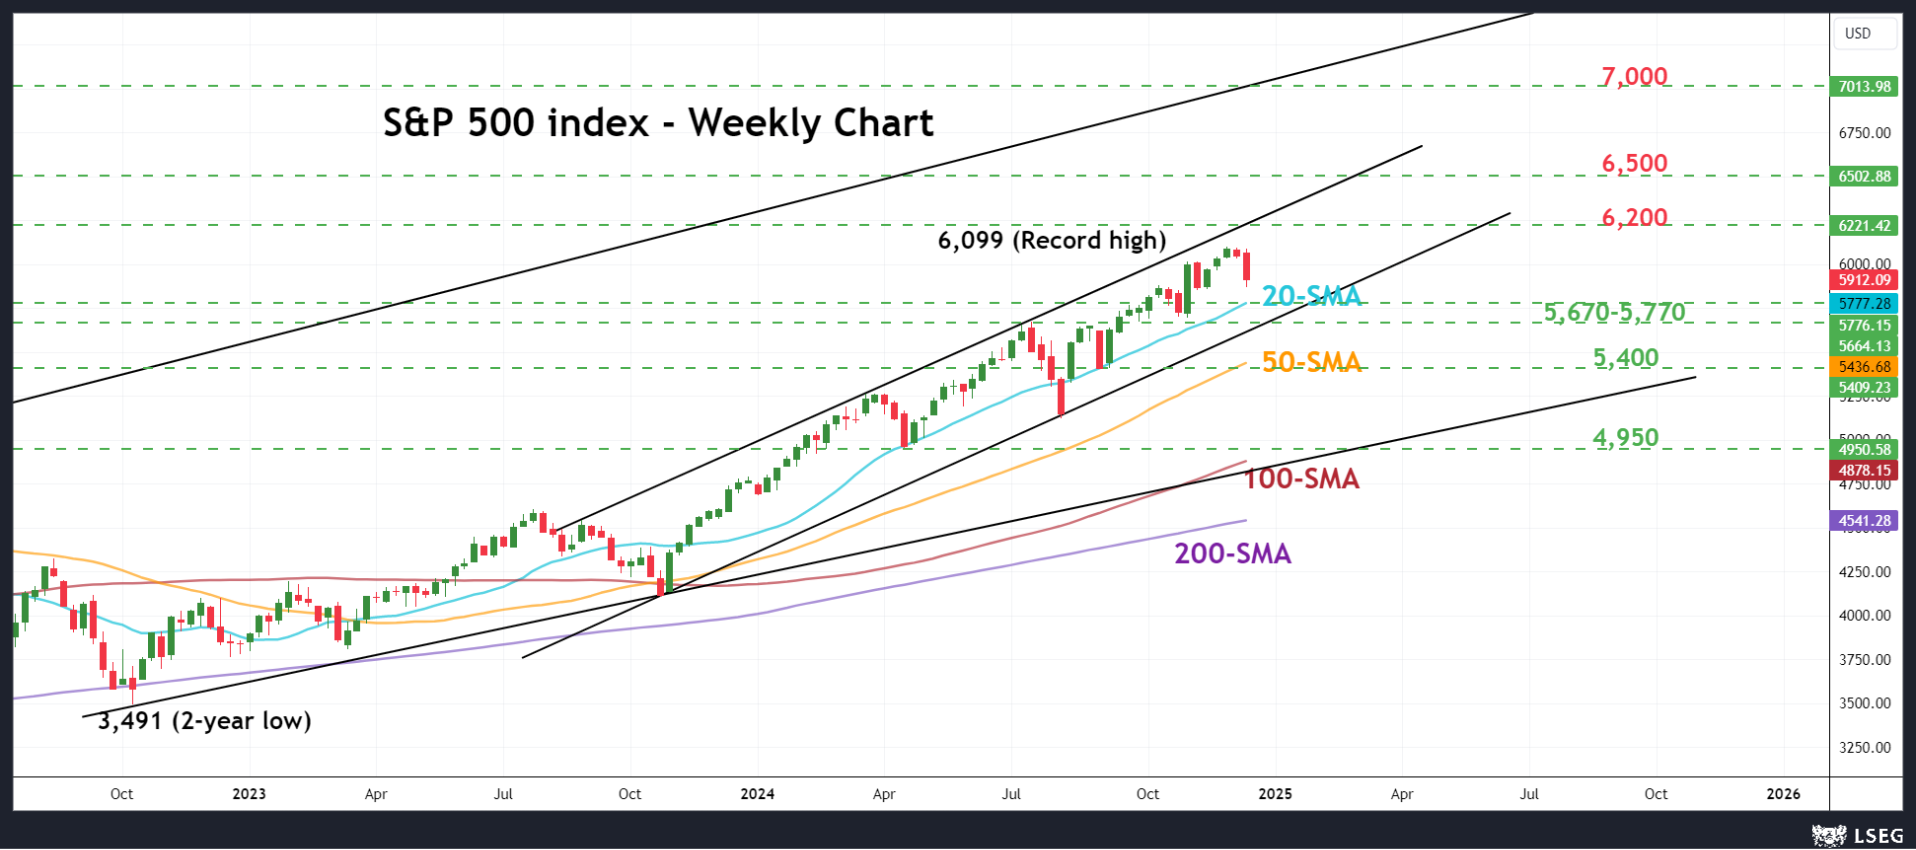
The U.S. stock market has achieved extraordinary gains during the typically weak May-October period, marking the strongest mid-year performance since 1950 [1]. Market data confirms this exceptional rally [0]:
- S&P 500: +21.60% from May 1 to October 31, 2025 (from $5,625.14 to $6,840.19)
- NASDAQ Composite: +33.34% (from $17,793.14 to $23,724.96)
- Dow Jones Industrial: +16.24% (from $40,918.04 to $47,562.88)
According to MarketWatch, the S&P 500 advanced 22.9% during this period, while the Dow gained nearly 17% and the Nasdaq surged 36% [1]. This performance occurred over 128 trading days with relatively low volatility (S&P 500 volatility at 0.72%) [0].
Recent sector performance on October 31, 2025, reveals interesting divergences [0]:
- Top performers: Energy (+2.81%), Real Estate (+1.77%), Financial Services (+1.38%)
- Underperformers: Technology (-1.74%), Utilities (-2.00%), Basic Materials (-1.30%)
The technology sector’s underperformance is particularly noteworthy given its substantial contribution to the overall rally, suggesting potential rotation or profit-taking in growth stocks.
While U.S. markets have shown remarkable strength, Asian markets are experiencing pressure on November 1, 2025 [0]:
- Shanghai Composite: -0.81%
- Shenzhen Component: -1.14%
- ChiNext Index: -2.31%
- CSI 300: -1.47%
This divergence indicates that the U.S. rally may be driven by domestic factors rather than synchronized global growth.
The rally’s exceptional nature creates both opportunities and concerns. A 22.9% S&P 500 gain during the typically weak May-October period is unprecedented since 1950 [1]. This raises important questions about market psychology and potential overextension.
The MarketWatch article specifically questions whether this performance is “making investors too greedy ahead of year-end” [1], suggesting that behavioral factors may be contributing to the rally’s momentum.
CFRA analysts cited in the MarketWatch article identify several supporting factors [1]:
- Improving earnings growth expectations
- Potential December Fed rate cut
- Strong macroeconomic conditions
However, the article emphasizes that “economic conditions, earnings, geopolitics, along with fiscal, monetary and trade policy, are much bigger drivers of price action” than seasonal patterns [1], suggesting that fundamental factors rather than seasonal anomalies are driving the rally.
While the headline numbers are impressive, the recent sector rotation and technology underperformance suggest that market participation may be narrowing. This could indicate either healthy rotation or early signs of exhaustion in the growth-driven rally.
-
Overextension Risk: The magnitude and speed of gains suggest the market may be vulnerable to sharp corrections, particularly if earnings disappoint or economic data weakens [0]
-
Concentration Risk: Technology stocks’ significant contribution to the rally creates vulnerability to sector-specific shocks
-
Seasonal Reversal: While the traditional “sell in May” pattern was broken, markets often revert to historical norms after extended divergences
-
Policy Uncertainty: Geopolitical events, trade policy changes, or unexpected Fed actions could quickly reverse sentiment
Despite the risks, several opportunities exist:
- Earnings Validation: Strong Q4 2025 earnings could validate current valuations and support further gains
- Fed Policy Support: December rate cuts could provide additional momentum
- Sector Rotation: Ongoing rotation into undervalued sectors could provide new leadership
Decision-makers should closely track:
- Earnings Season Results: Q4 2025 earnings will be critical for validating current valuations
- Fed Policy Signals: Any indication that December rate cuts are less likely could trigger selling
- Volatility Indicators: Rising VIX levels could signal increasing market stress
- Institutional Positioning: Large institutional flows often precede market turning points
The U.S. stock market’s record-breaking rally represents a significant market event with both positive and concerning aspects. The 22.9% S&P 500 gain during May-October 2025 defies historical patterns and reflects strong underlying fundamentals, including improving earnings expectations and potential monetary policy support [1].
However, the exceptional nature of these gains, combined with concerns about investor greed and potential overextension, suggests that caution is warranted as markets approach year-end [1]. The recent sector rotation and divergence from global market performance add complexity to the outlook.
Critical factors to monitor include Q4 earnings results, Fed policy signals, and volatility indicators. The market’s ability to sustain current valuations will depend on continued earnings growth and macroeconomic stability.
Insights are generated using AI models and historical data for informational purposes only. They do not constitute investment advice or recommendations. Past performance is not indicative of future results.
About us: Ginlix AI is the AI Investment Copilot powered by real data, bridging advanced AI with professional financial databases to provide verifiable, truth-based answers. Please use the chat box below to ask any financial question.