S&P 500 New Highs Analysis: Sector Rotation and Valuation Concerns
Unlock More Features
Login to access AI-powered analysis, deep research reports and more advanced features
About us: Ginlix AI is the AI Investment Copilot powered by real data, bridging advanced AI with professional financial databases to provide verifiable, truth-based answers. Please use the chat box below to ask any financial question.
Related Stocks
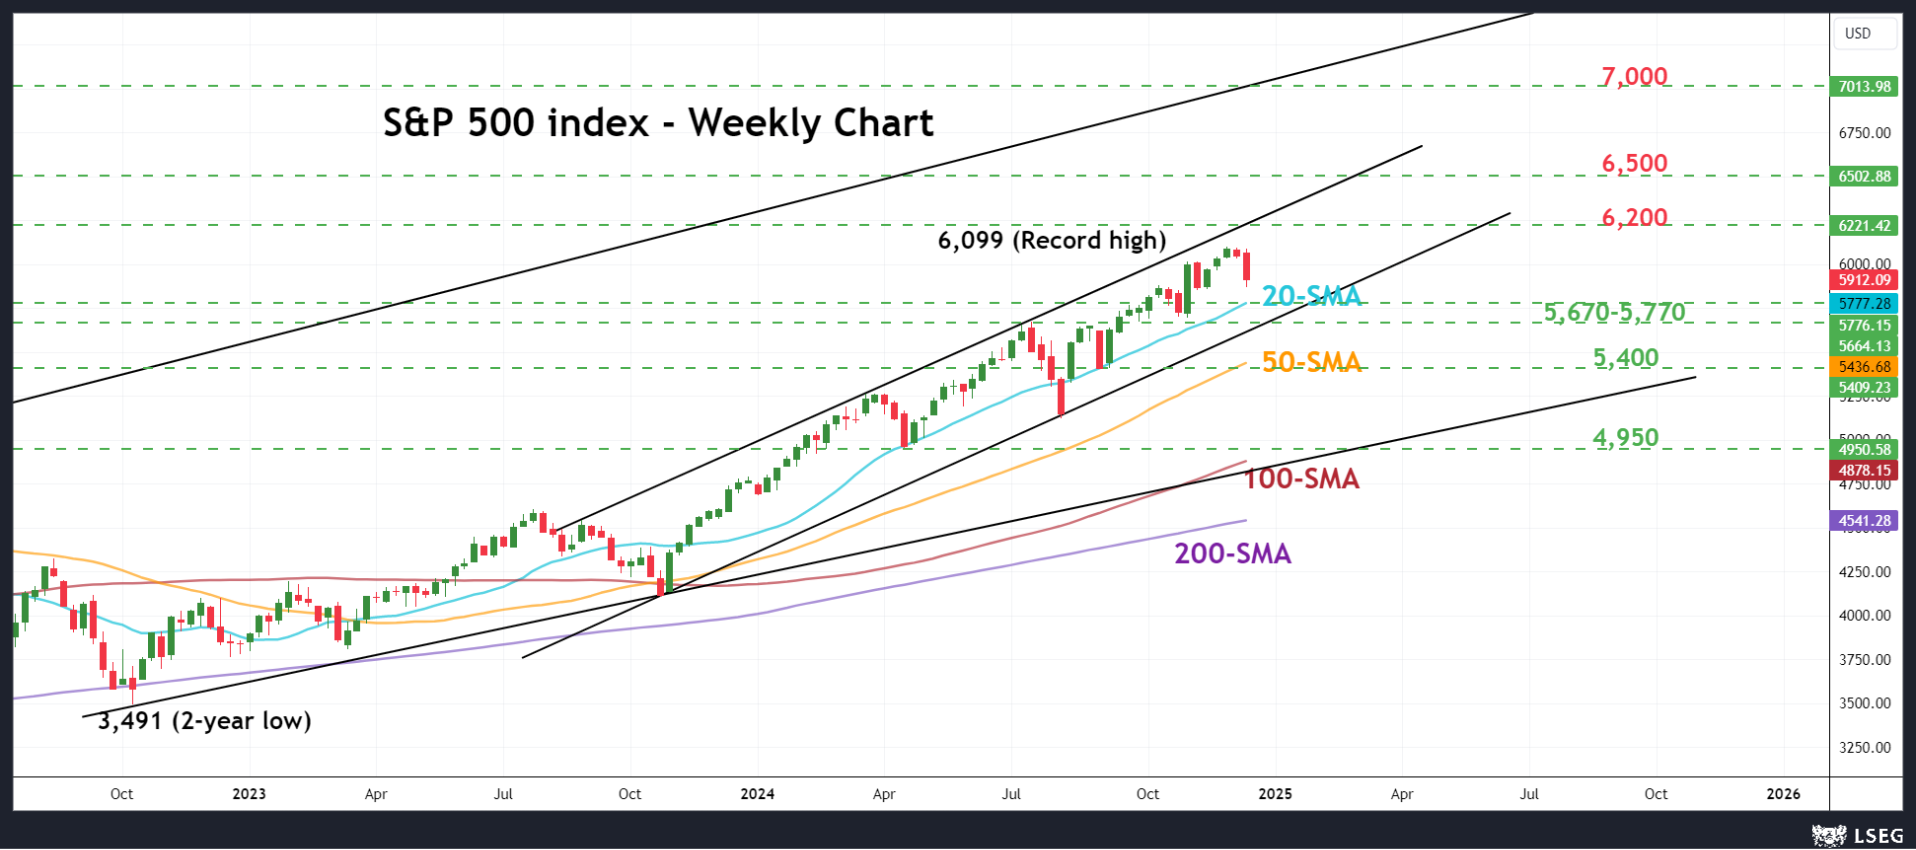
This analysis is based on the Seeking Alpha report [1] published on November 1, 2025, which reported that the S&P 500 achieved two new record highs during the week of October 27-31, 2025, continuing a strong uptrend from October 2022 despite macroeconomic uncertainties.
Market data validates the new highs, with the S&P 500 (^GSPC) reaching 6,874.6 on October 28, 2025, representing a new record level [0]. The index closed the week at 6,840.19 on October 31, down 0.5% from the previous session but maintaining its upward trajectory [0]. The rally was characterized by technology and high-beta stock leadership, while defensive sectors underperformed and growth stocks significantly outperformed value stocks [1].
However, current sector performance data reveals a more complex picture. While the report claims tech leadership, recent data shows Technology sector underperformance at -1.74% [0]. This discrepancy suggests either timing differences in measurement periods or concentration within mega-cap tech stocks versus broader sector performance. The QQQ (NASDAQ-100 ETF) did outperform SPY (+0.48% vs +0.33%) [0], supporting the tech leadership narrative at the index level.
Current sector leadership shows Energy (+2.81%), Real Estate (+1.77%), Financial Services (+1.38%), and Communication Services (+1.15%) as top performers [0], while Utilities (-2.00%), Technology (-1.74%), Basic Materials (-1.30%), and Consumer Defensive (-0.34%) lagged [0].
The S&P 500’s recent new highs represent the continuation of a strong uptrend from October 2022, driven primarily by technology and high-beta stocks with growth outperforming value [1]. Current market data confirms the index reached record levels of 6,874.6 on October 28, 2025 [0], though sector performance reveals nuanced dynamics with Technology showing recent underperformance despite QQQ’s relative outperformance [0].
Valuation metrics indicate the market is trading at elevated levels, with SPY at 28.80x P/E and QQQ at 35.47x P/E [0], approaching historical extremes that may limit future returns. Market breadth has narrowed to only 4 positive sectors [0], creating concentration risk despite robust trading volumes indicating strong institutional participation [0].
The market advance continues despite macroeconomic uncertainties including trade tensions and regulatory changes [2], suggesting both underlying momentum and vulnerability to policy shocks. Technical levels show the index trading near 52-week highs with key support around 6,800 and resistance near recent highs of 6,875 [0].
Insights are generated using AI models and historical data for informational purposes only. They do not constitute investment advice or recommendations. Past performance is not indicative of future results.
About us: Ginlix AI is the AI Investment Copilot powered by real data, bridging advanced AI with professional financial databases to provide verifiable, truth-based answers. Please use the chat box below to ask any financial question.