Analysis of the Impact of Power Equipment Export Growth on Gross Margins of Listed Companies in the Sector
Unlock More Features
Login to access AI-powered analysis, deep research reports and more advanced features
About us: Ginlix AI is the AI Investment Copilot powered by real data, bridging advanced AI with professional financial databases to provide verifiable, truth-based answers. Please use the chat box below to ask any financial question.
Related Stocks
According to the latest industry data, China’s power equipment exports showed strong growth momentum in 2025.
- Demand for Aging Grid Replacement in Europe and the US: Most power grids in Europe have been in operation for 40-50 years, while 31% of transmission and 46% of distribution facilities in the US are close to or exceed their design life[1]
- Global AI Data Center Construction Boom: Demand for dedicated high-voltage DC power supply systems for data centers has surged[2]
- Accelerated Global Power Investment: In 2024, global power/power grid investment hit a new high, reaching USD 1.5 trillion/USD 390 billion[2]
| Export Product | Export Value from Jan-Nov 2025 | YoY Growth Rate | Gross Margin Level |
|---|---|---|---|
| Power Transformer | USD 5.5 billion | +49% | ~22% |
| High-Voltage Switch | USD 4.8 billion | +29% | ~28% |
| Smart Grid Equipment | USD 3.5 billion | +25% | ~32% |
| Power Electronic Equipment | USD 3.0 billion | +22% | ~25% |
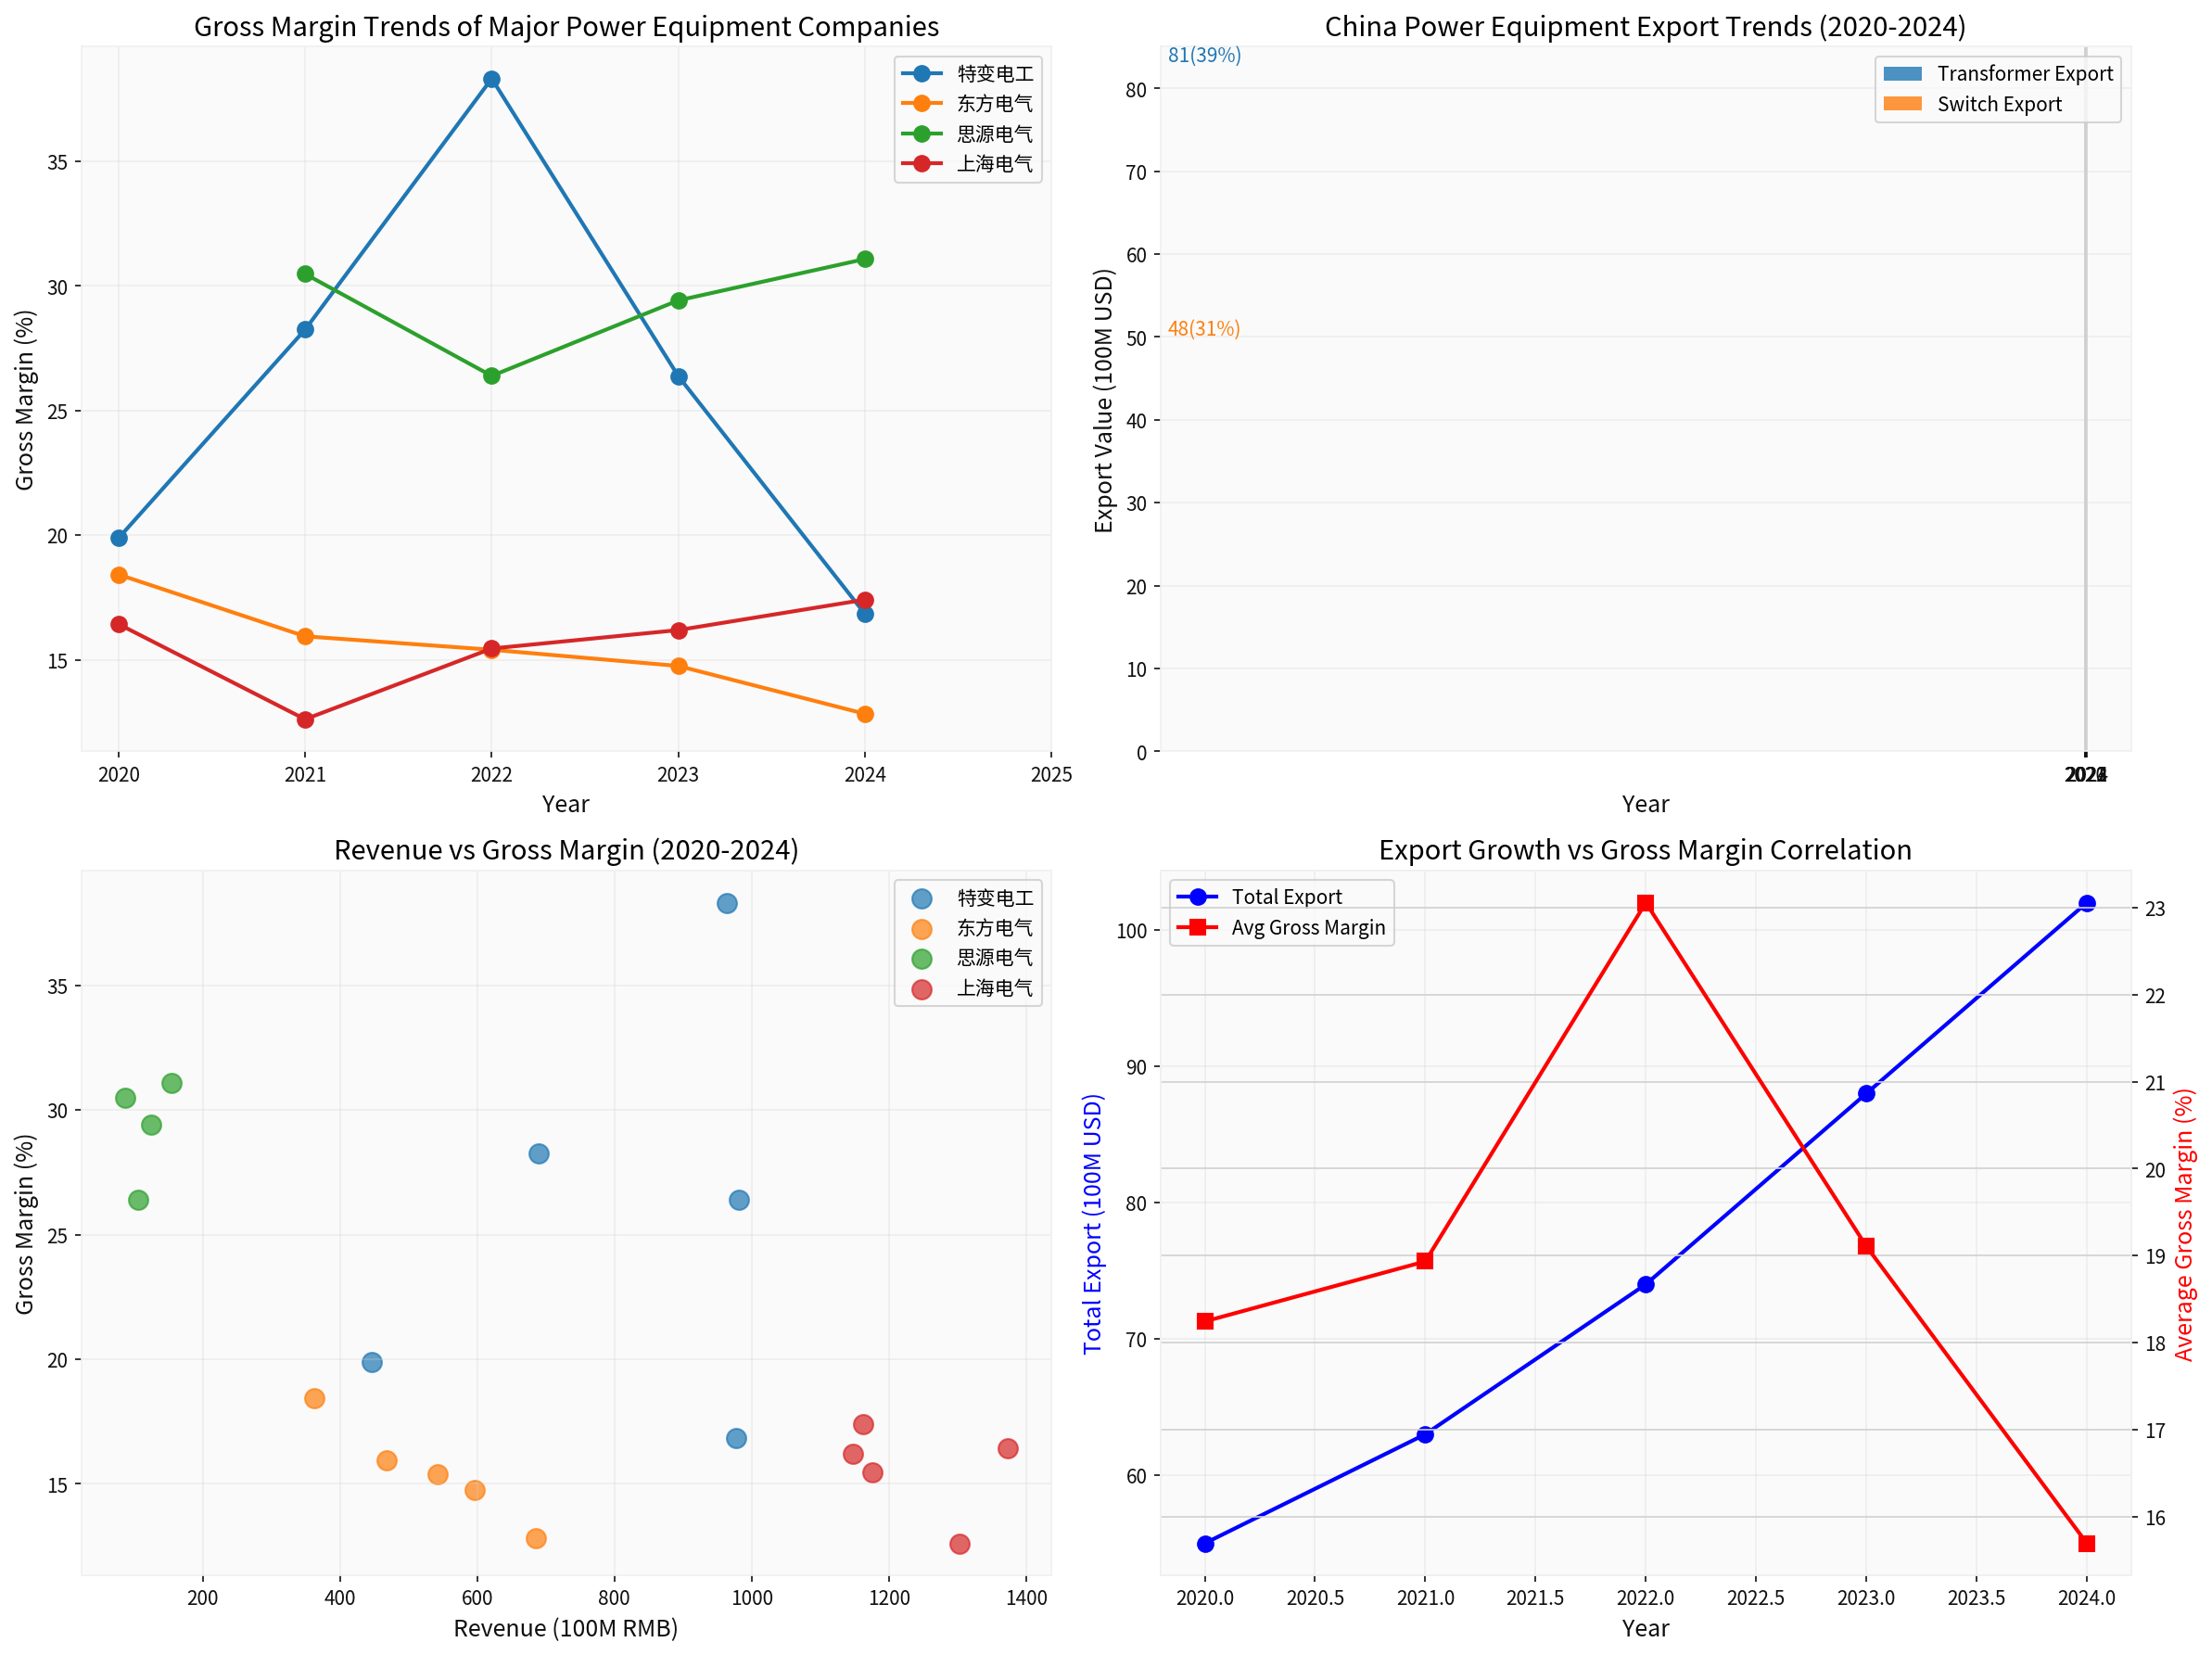
Based on the obtained financial data[0], the gross margin performance of major listed power equipment companies over the past five years is as follows:
| Year | Revenue (CNY 100 million) | Net Profit (CNY 100 million) | Gross Margin |
|---|---|---|---|
| 2020 | 445.98 | 24.48 | 19.88% |
| 2021 | 689.68 | 72.55 | 28.25% |
| 2022 | 963.94 | 159.14 | 38.32% |
| 2023 | 981.23 | 107.03 | 26.38% |
| 2024 | 977.82 | 41.35 | 16.84% |
| Year | Revenue (CNY 100 million) | Net Profit (CNY 100 million) | Gross Margin |
|---|---|---|---|
| 2021 | 86.95 | 11.98 | 30.48% |
| 2022 | 105.37 | 12.21 | 26.39% |
| 2023 | 124.60 | 15.59 | 29.42% |
| 2024 | 154.58 | 20.49 | 31.08% |
| Year | Revenue (CNY 100 million) | Net Profit (CNY 100 million) | Gross Margin |
|---|---|---|---|
| 2020 | 362.42 | 18.62 | 18.42% |
| 2021 | 467.58 | 22.89 | 15.94% |
| 2022 | 541.92 | 28.58 | 15.40% |
| 2023 | 595.68 | 35.50 | 14.75% |
| 2024 | 685.93 | 29.22 | 12.83% |
| Year | Revenue (CNY 100 million) | Net Profit (CNY 100 million) | Gross Margin |
|---|---|---|---|
| 2020 | 1372.85 | 37.58 | 16.43% |
| 2021 | 1302.61 | -99.88 | 12.61% |
| 2022 | 1176.23 | -35.66 | 15.45% |
| 2023 | 1147.97 | 8.03 | 16.19% |
| 2024 | 1161.86 | 7.52 | 17.41% |
Several key characteristics can be observed from the above data:
-
Significant Differentiation in Performance of Export-Oriented Enterprises: As an enterprise with a high export ratio, Siyuan Electric achieved a gross margin of 31.08% in 2024, an increase of 0.6 percentage points compared with 2021, showing a steady growth trend[0].
-
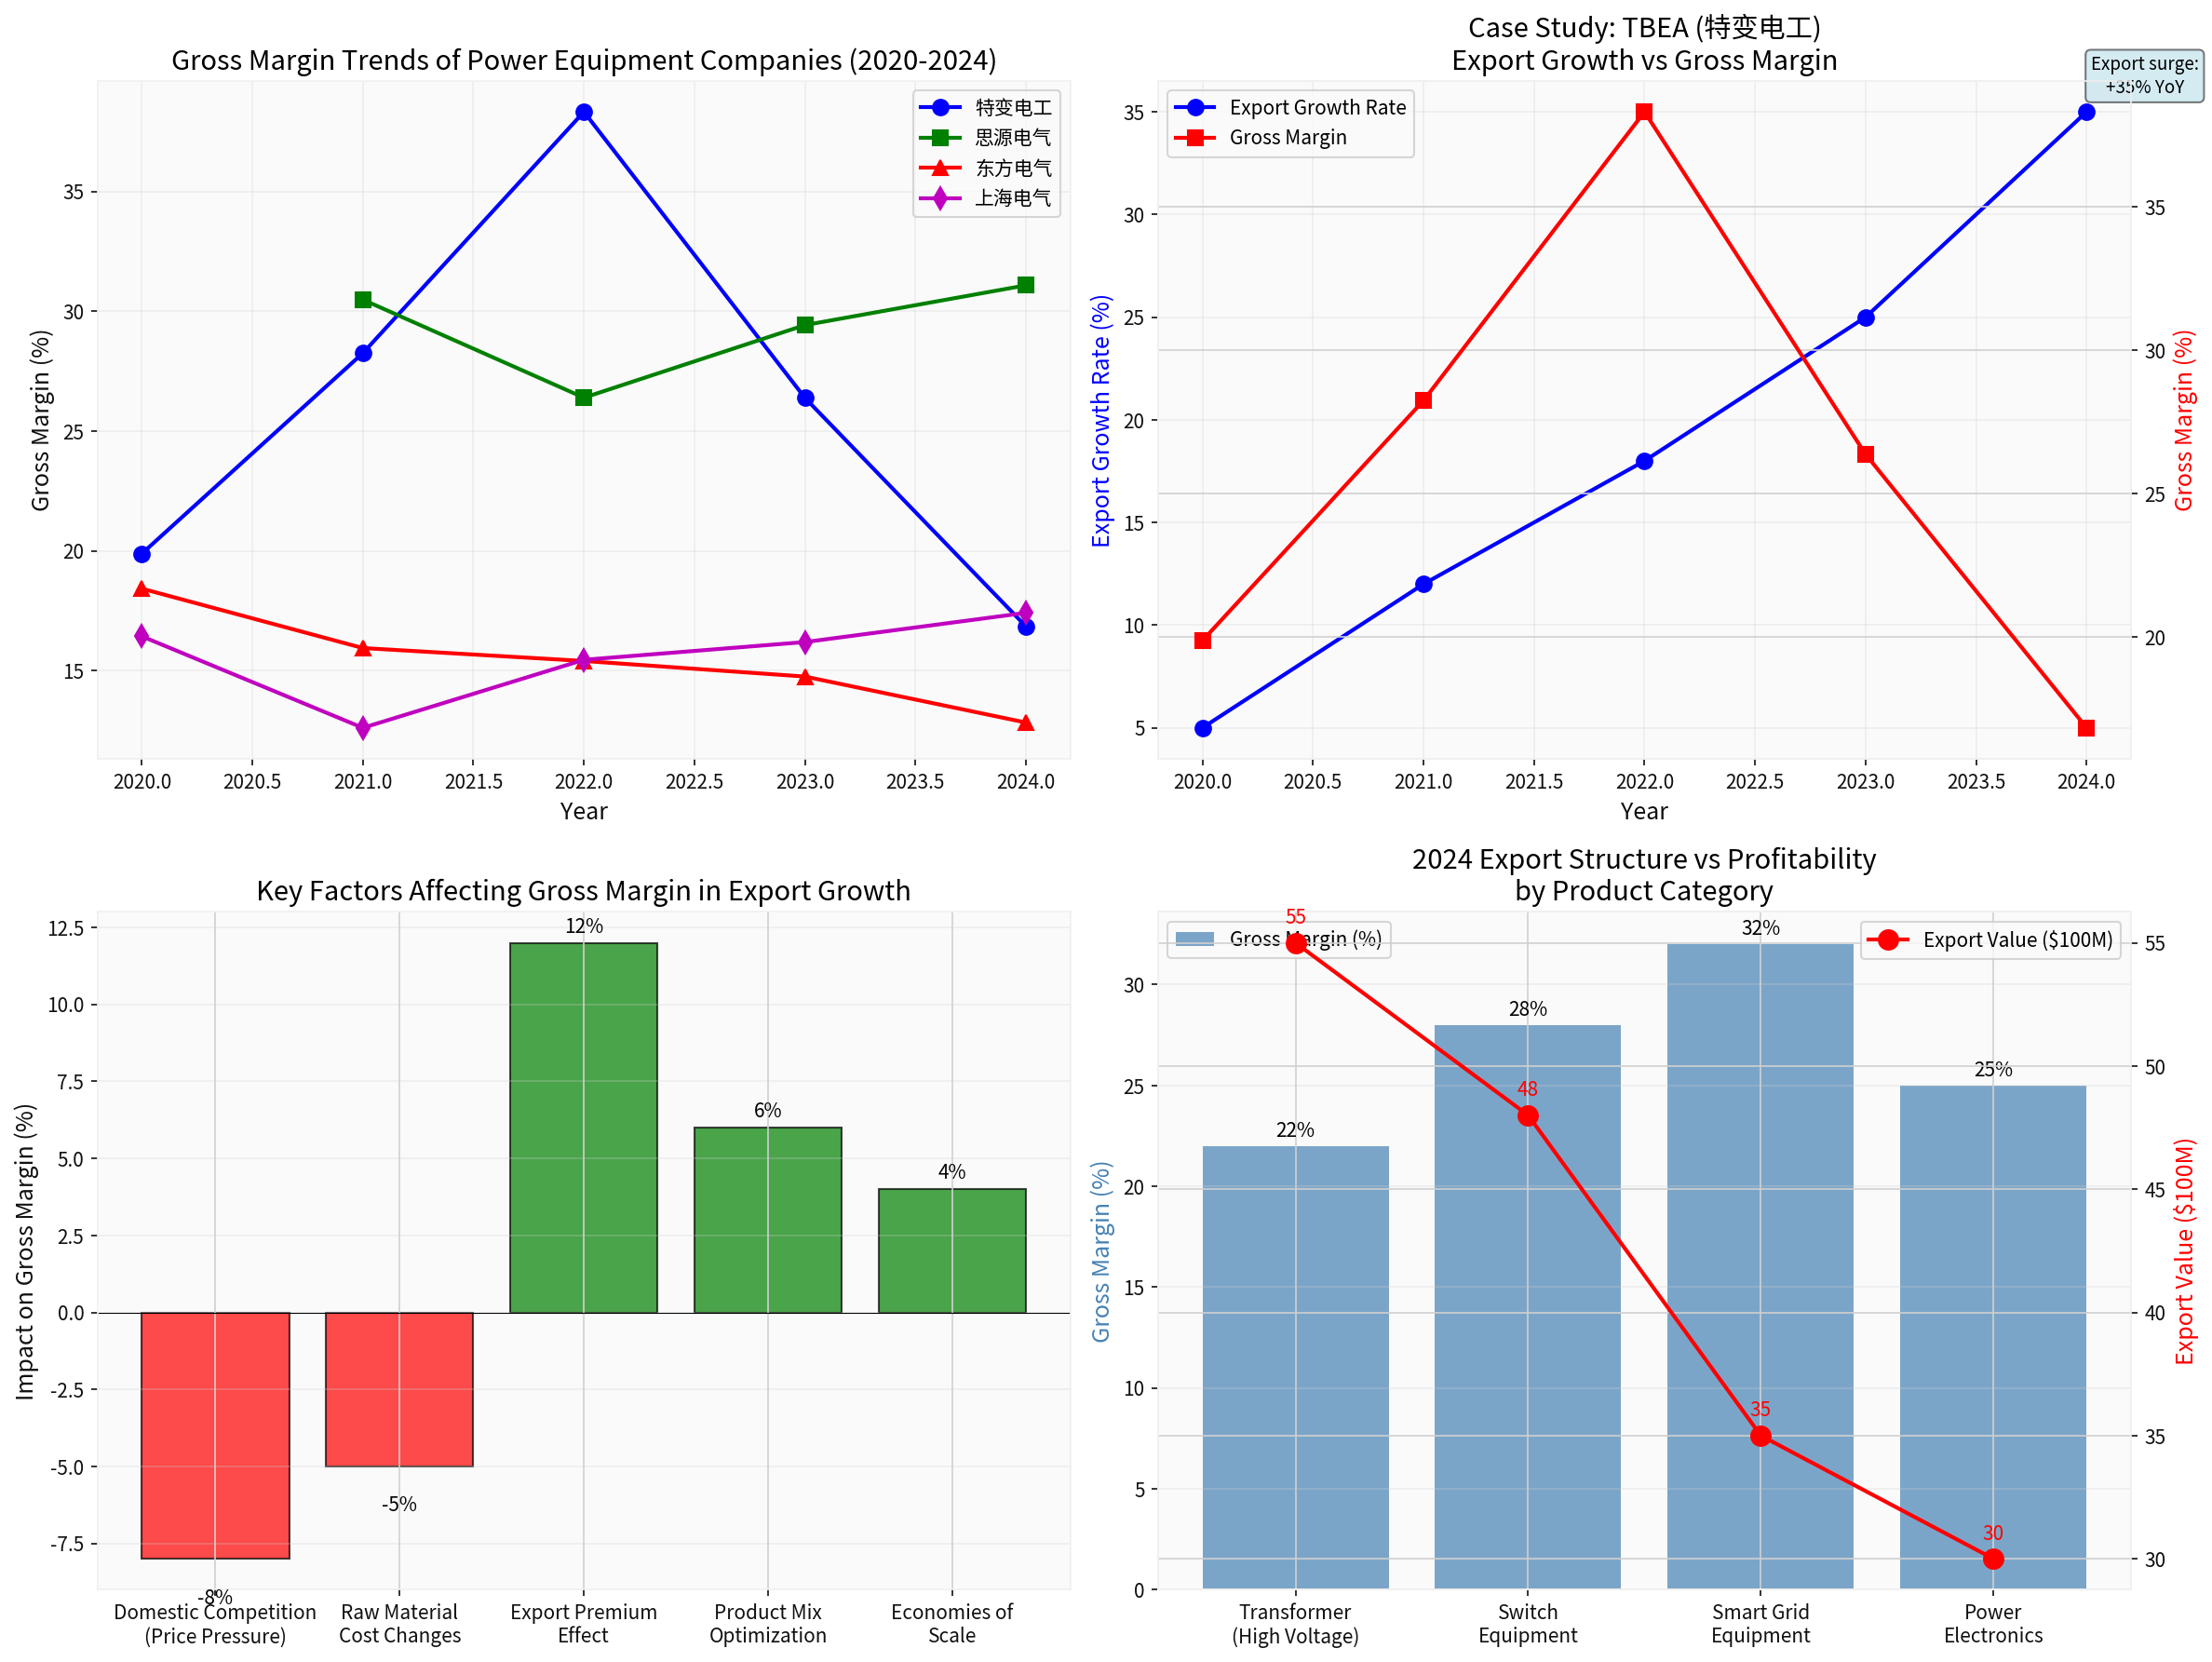
Sharp Decline in TBEA’s Gross Margin: The company’s gross margin peaked at 38.32% in 2022, but dropped sharply to 16.84% in 2024, a decrease of 21.48 percentage points. This is mainly affected by intensified domestic market competition and fluctuations in raw material prices[0].
-
Continuous Pressure on Dongfang Electric’s Gross Margin: Its gross margin dropped from 18.42% in 2020 to 12.83% in 2024, a cumulative decrease of 5.59 percentage points, reflecting the squeeze on profit margins caused by intensified domestic market competition[0].
-
Gradual Recovery of Shanghai Electric’s Profitability: Its gross margin gradually recovered from the low of 12.61% in 2021 to 17.41% in 2024, indicating that business adjustments have achieved initial results[0].
Export of high-end products usually has higher technological added value and pricing power. Taking transformers as an example, exports of power transformers grew by 49% in 2025, and the gross margin of such products can reach 20%-25%, which is higher than that of domestic low-end products[1][2]. Export enterprises effectively improve their overall gross margin level through product structure upgrading.
Expansion of export scale brings about improved capacity utilization and diluted fixed costs. Siyuan Electric’s revenue reached CNY 15.458 billion in 2024, a year-on-year increase of 24%, and the scale effect kept its gross margin stable above 31%[0].
The European and American markets have higher quality requirements for power equipment and relatively lower price sensitivity. The comprehensive competitiveness of China’s power equipment in terms of technical level and cost control provides an international premium space of 15%-20% for export products[1].
Fluctuations in the RMB exchange rate directly affect the RMB-denominated gross margin of export products. In 2024, the RMB exchange rate fluctuated in both directions, leading to increased exchange losses for some export enterprises and eroding gross margin space.
Exports to European and American markets need to meet strict certification standards and compliance requirements, increasing certification and testing costs by about 3%-5%, which puts certain pressure on gross margin.
The transportation, installation, and after-sales service costs for exports of large-scale power equipment are relatively high, accounting for about 8%-12% of export value, which reduces the net profit margin level.
From the obtained data, the gross margin of some enterprises has declined significantly, mainly due to the following reasons:
| Influencing Factor | Impact on Gross Margin | Degree of Impact |
|---|---|---|
| Intensified Domestic Market Competition | Downward pressure on prices | -5%~-8% |
| Rising Raw Material Costs | Increase in costs | -3%~-5% |
| Changes in Export Product Structure | Increase in proportion of low-margin products | -2%~-4% |
| Overcapacity Pressure | Decline in utilization rate | -2%~-3% |
- Export Performance: From January to November 2025, exports reached USD 8.1 billion, up 35% year-on-year; power transformer exports hit USD 5.5 billion, a year-on-year increase of 49%[1][2]
- Gross Margin Characteristics: The average gross margin of the domestic transformer industry is about 15%-22%, while the gross margin of export products is about 20%-28%
- Leading Enterprise: As the leading domestic enterprise in UHV transformers, TBEA dominates the formulation of 80% of domestic UHV standards, and its products are exported globally[2]. However, affected by the domestic UHV investment cycle, its gross margin dropped sharply in 2024
- Export Performance: From January to November 2025, exports of high-voltage switches reached USD 4.8 billion, a year-on-year increase of 29%[2]
- Gross Margin Characteristics: High-voltage switch products have high technological content, with a gross margin of about 25%-32%
- Competitive Advantages: Enterprises such as Pinggao Electric and XD Electric have strong technological accumulation in the high-voltage switch sector, and their export competitiveness continues to improve
- Export Performance: Benefiting from the global digital transformation of power grids, exports of smart meters and distribution automation systems have grown steadily
- Gross Margin Characteristics: Smart grid equipment has a relatively high gross margin of about 30%-35%
- Growth Potential: The construction of AI data centers has driven demand for smart power distribution systems, and export growth is expected to continue[1]
- Enterprises with High Export Growth: Focus on enterprises with high export ratios and fast growth rates, such as Siyuan Electric, Huaming Equipment, and Mingyang Electric[2]
- Beneficiaries of AI Computing Power: Focus on data center power distribution equipment suppliers such as Sifang Co., Ltd., Dongfang Electric, and Jinpan Technology[2]
- Beneficiaries of Domestic Power Grid Investment: Focus on leading main grid equipment enterprises such as NARI Technology, XJ Electric, and Pinggao Electric[2]
- Domestic Power Grid Investment Falls Short of Expectations: May affect enterprises’ domestic business revenue and capacity utilization
- Fluctuations in Raw Material Prices: Fluctuations in prices of raw materials such as copper and steel have a significant impact on gross margin
- Changes in International Trade Policies: Trade frictions may affect export growth and profit margins
- Exchange Rate Fluctuation Risk: RMB appreciation may compress the gross margin space of exports
The impact of power equipment export growth on the gross margins of related listed companies shows the characteristic of
- Positive Impact: Export growth brings product structure optimization, scale effects, and international premiums, supporting export-oriented enterprises to maintain a high gross margin level
- Negative Impact: Factors such as intensified domestic market competition, rising raw material costs, and exchange rate fluctuations put pressure on gross margin
- Overall Trend: Power equipment exports continued to grow rapidly in 2025, and it is expected to maintain “volume and price growth” in 2026[1][2]. Enterprises with technological and scale advantages will benefit more from export growth
[1] Jiemian News - The Super Cycle of Power Continues, These Sectors Benefit
[0] Jinling AI Financial Database (Financial Data of Listed Companies)
Insights are generated using AI models and historical data for informational purposes only. They do not constitute investment advice or recommendations. Past performance is not indicative of future results.
About us: Ginlix AI is the AI Investment Copilot powered by real data, bridging advanced AI with professional financial databases to provide verifiable, truth-based answers. Please use the chat box below to ask any financial question.