Analysis of Cyclical Characteristics of Flat Glass's Photovoltaic Glass Business
Unlock More Features
Login to access AI-powered analysis, deep research reports and more advanced features
About us: Ginlix AI is the AI Investment Copilot powered by real data, bridging advanced AI with professional financial databases to provide verifiable, truth-based answers. Please use the chat box below to ask any financial question.
Related Stocks
Based on the above data collection and analysis, we now provide you with a report on the cyclical characteristics of Flat Glass’s photovoltaic glass business:
The photovoltaic glass industry is currently in a
The continuous decline in capacity utilization further confirms the characteristics of the cycle bottom. In 2024, the capacity utilization rate of China’s photovoltaic glass industry was only 78.8%, a historical cyclical low [3]. This phenomenon is mainly due to oversupply caused by rapid capacity expansion in the early stage, forcing enterprises to balance supply and demand through active production cuts, cold repair of kilns, and other measures. The China Business Industry Research Institute predicts that the capacity utilization rate will rebound to around 80% in 2025 [3], indicating that the industry is gradually moving towards supply-demand balance.
The capacity cycle of the photovoltaic glass industry exhibits obvious
From the perspective of new capacity rhythm, new capacity from January to November 2025 was 12,250 tons/day, a year-on-year decrease of 33% [5]. Enterprises ignited 8 new production lines (totaling 9,800 tons/day) from March to May, mainly due to strong demand during this period; demand experienced significant fluctuations from June to September, with no production lines ignited; one production line was ignited in each of October and November, mainly to validate the capacity indicators. In terms of cold repair capacity, the cold repair capacity from January to November 2025 was 18,850 tons/day, a decrease of 27% compared to the full year of 2024, with cold repair mainly concentrated in July, mainly due to weakening demand in the second half of the year [5].
The price cycle of photovoltaic glass exhibits typical characteristics of
The impact of the price cycle is clearly visible in Flat Glass’s financial data. In the first half of 2025, the company achieved revenue of RMB 7.74 billion, a year-on-year decrease of 28%; net profit attributable to shareholders was RMB 260 million, a year-on-year decrease of 83% [1]. Among them, the gross profit margin in Q2 2025 was approximately 16.7%, an increase of about 5 percentage points compared to the previous period, mainly due to the high glass price in April 2025 affected by rush installation [1].
The sources of price elasticity mainly include: 1. Demand fluctuations caused by seasonal changes in production scheduling of downstream modules; 2. Periodic supply-demand mismatches caused by changes in the inventory cycle; 3. Marginal impacts of industry self-discipline and anti-cutthroat competition policies. It is expected that the domestic average price of 2.0mm glass will remain at RMB 13-13.5 per square meter in 2026 [5].
The cost cycle of photovoltaic glass is mainly affected by
Flat Glass has obvious advantages in cost control. The company laid out silica sand mineral resources early, further increasing its self-supply ratio, and its silica sand procurement cost remains at a low level compared to the industry [6]. Coupled with the decline in soda ash and fuel prices, the company’s annual raw material and fuel procurement amount decreased by approximately 7% year-on-year [6]. This cost advantage is particularly important during a price downward cycle, helping the company maintain certain profitability when the industry is generally in loss.
Flat Glass’s financial data clearly reflects the cyclical characteristics of the photovoltaic glass industry. From annual data, in 2024, the company achieved revenue of approximately RMB 18.683 billion (calculated based on rating report data), with a gross profit margin of approximately 15.5% [6], a significant decrease from 21.80% in 2023. This gross profit margin is in the lower range of the company’s history, equivalent to the cycle bottom in 2018-2019.
From quarterly data, in Q2 2025, the company achieved revenue of RMB 3.66 billion, a year-on-year decrease of 26% and a month-on-month decrease of 10%; net profit attributable to shareholders was RMB 155 million, a year-on-year decrease of 79% and a month-on-month increase of 46% [1]. The month-on-month rebound in Q2 profit mainly benefited from the increase in glass prices, with the calculated net profit per square meter being approximately RMB 1.1-1.2 (after excluding impairment losses), a month-on-month increase of RMB 0.7-0.8 [1].
During the industry downward cycle, Flat Glass’s cash flow management has been stable. The company’s operating cash inflow in Q2 2025 was RMB 1.23 billion, a year-on-year increase of RMB 90 million [1]. In terms of accounts receivable, at the end of 2024, accounts receivable within one year accounted for 98.71% of the total, with accumulated bad debt provisions of RMB 97 million, and the risk of payment collection is relatively controllable [6]. In terms of inventory, inventory at the end of Q2 2025 was RMB 1.96 billion, a month-on-month increase of approximately 34%, mainly due to the high overall inventory level in the industry [1].
From the perspective of the capital expenditure cycle, the company’s capacity construction pace has slowed significantly. The Anhui project (21,200 tons/day) and Nantong project (41,200 tons/day) will be ignited and put into operation sequentially according to market conditions [1]. The plan for the 21,600-ton kiln in Indonesia has been slightly delayed, and it is expected to be ignited and put into operation by the end of 2027 [1]. This prudent capacity expansion strategy helps the company preserve its strength at the bottom of the cycle.
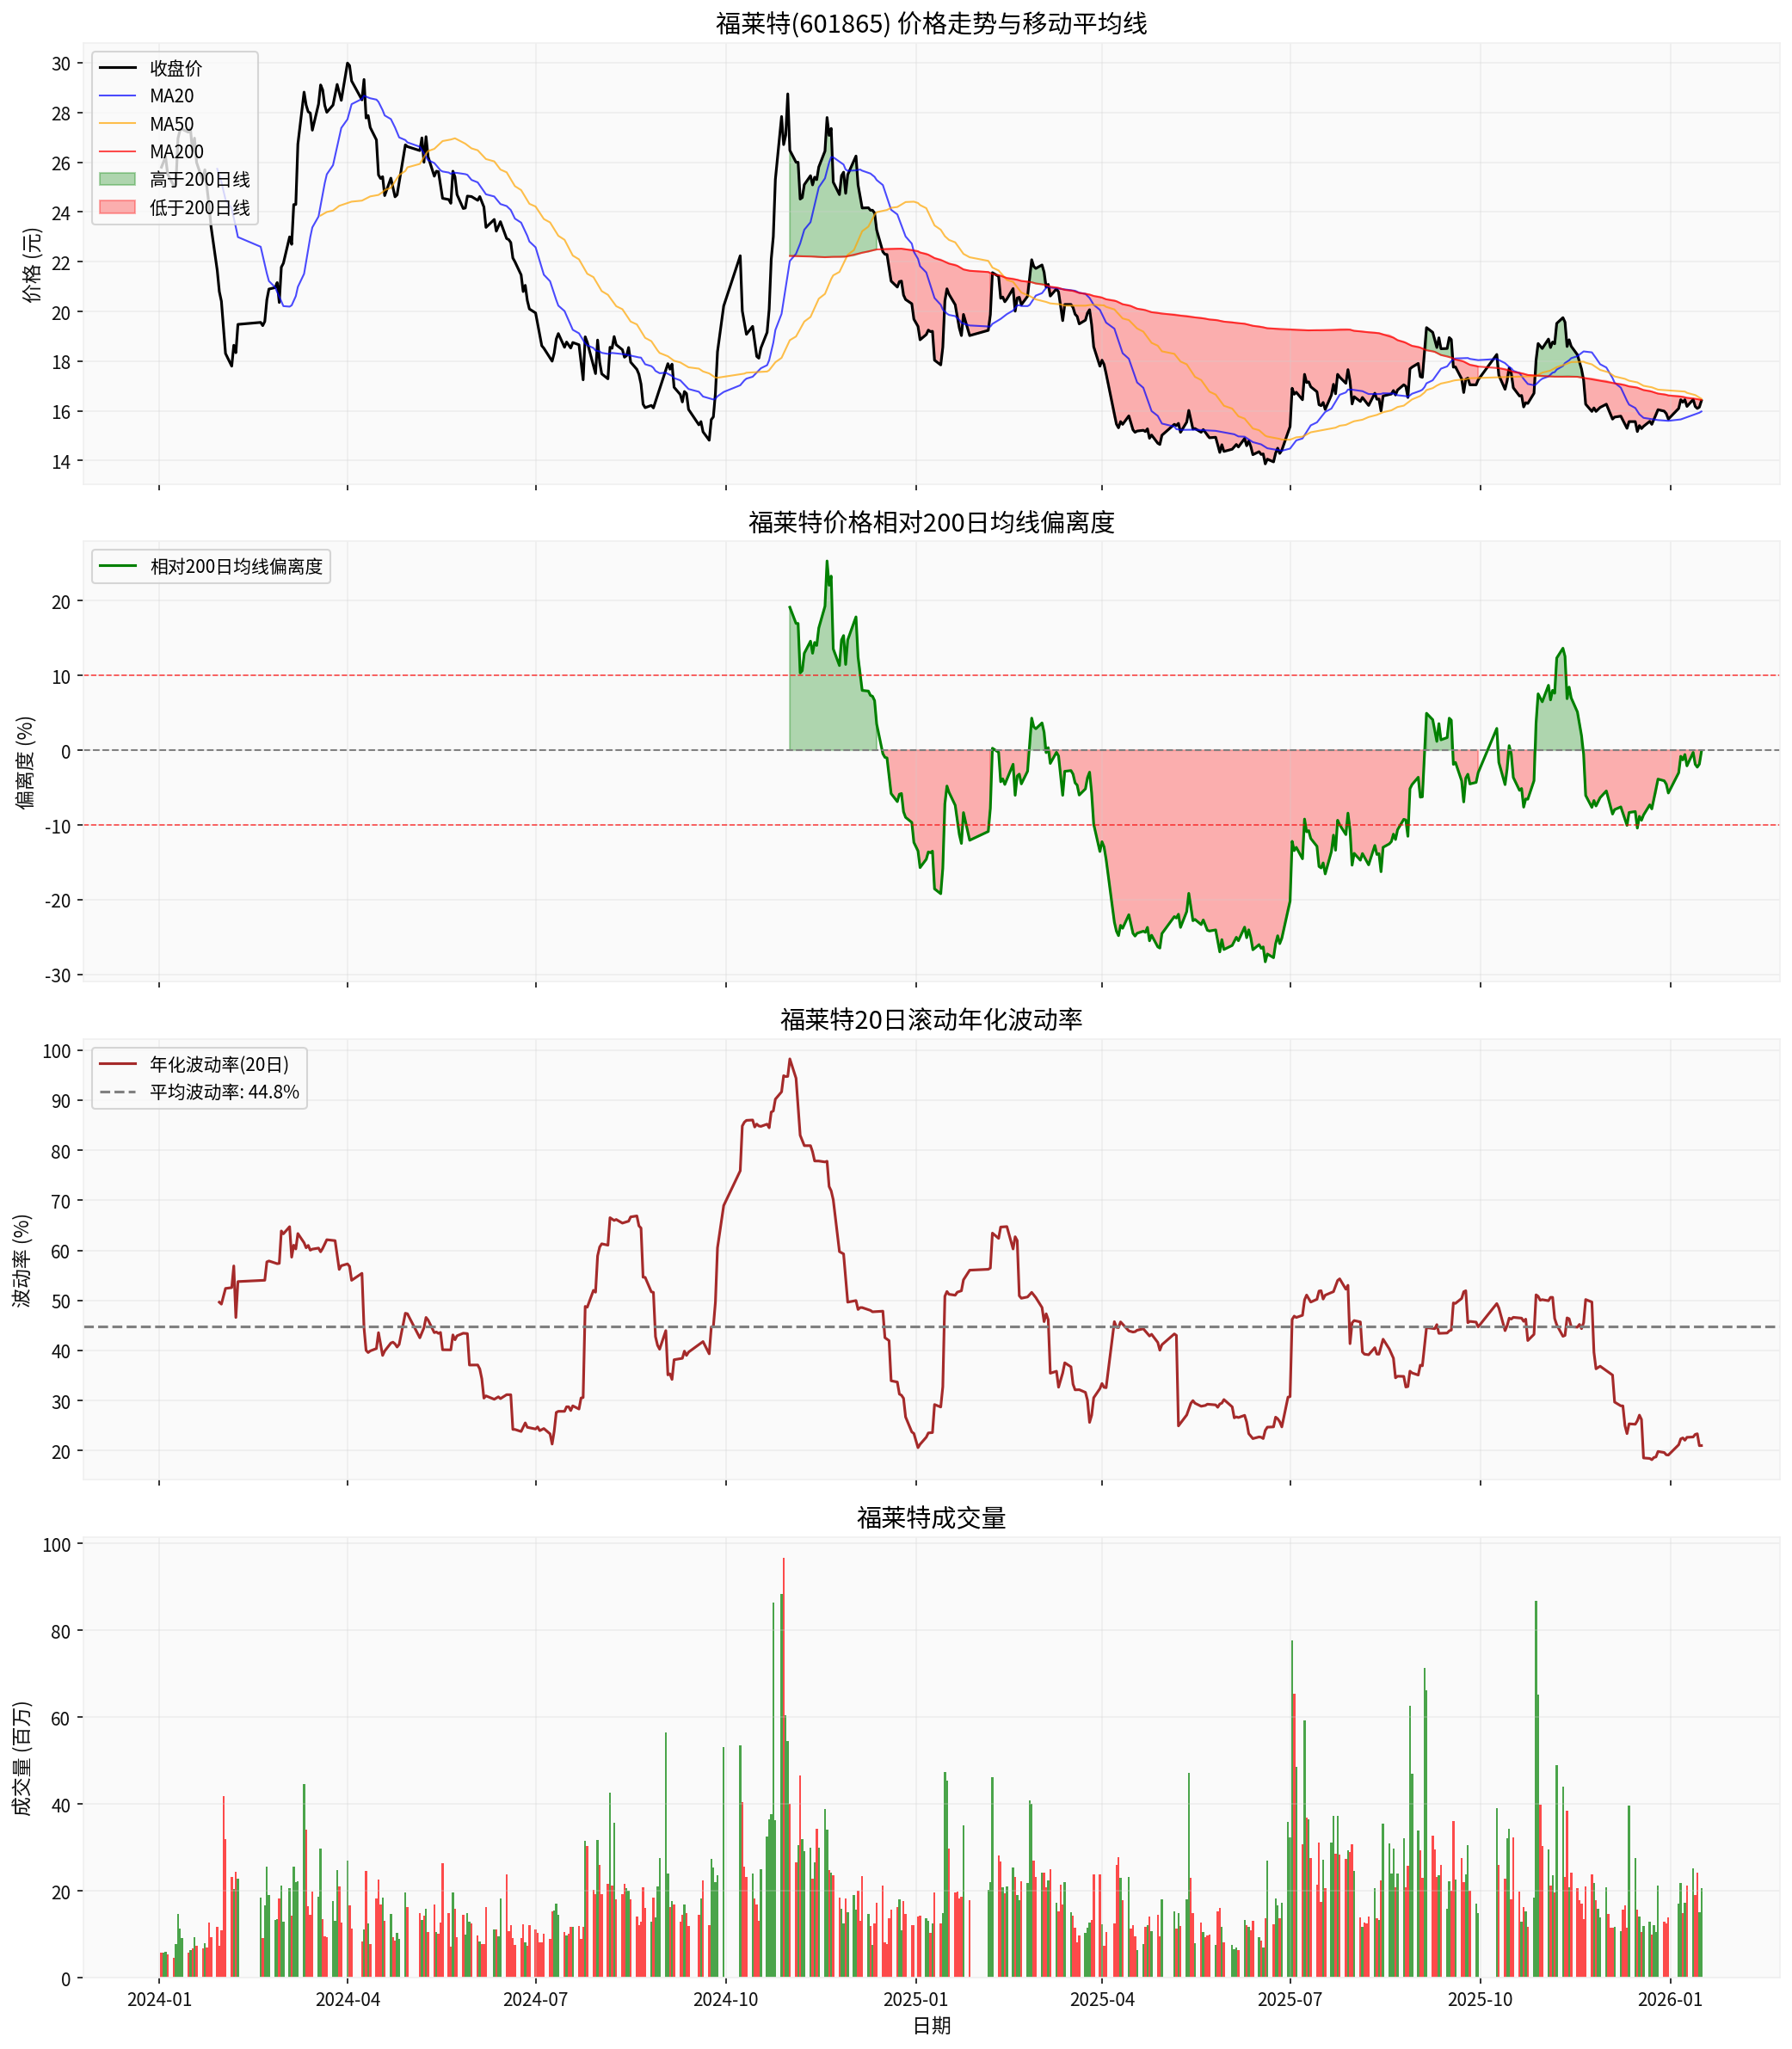
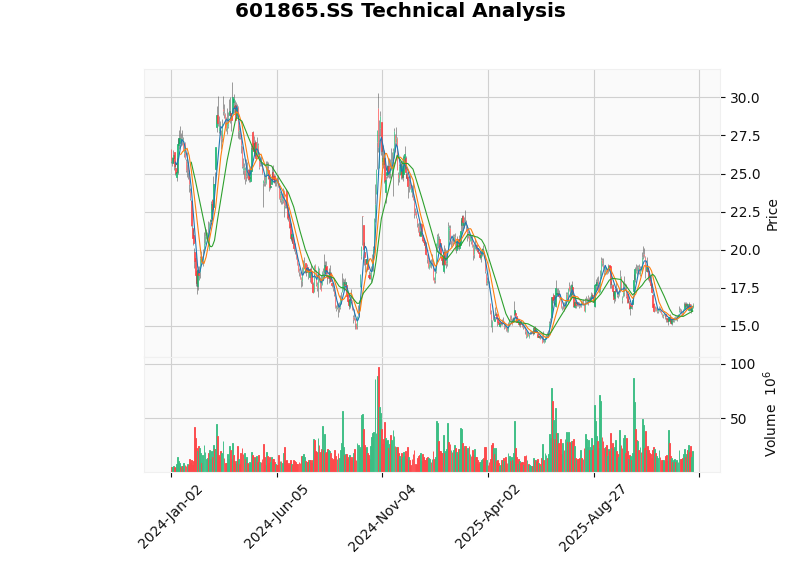
From the perspective of stock price performance, Flat Glass (601865.SS) exhibits obvious cyclical fluctuation characteristics. Since 2024, the stock price has continued to fall from approximately RMB 26 at the beginning of the year, hitting a low of RMB 13.85, with a fluctuation range of 123.83% [7]. As of January 16, 2026, the stock price closed at RMB 16.41, a decrease of approximately 37% compared to the beginning of 2024.
From a technical analysis perspective, the current stock price is slightly below the 200-day moving average (RMB 16.44), with a deviation of -0.18% [7]. The beta coefficient is 1.41, indicating higher elasticity relative to the Shanghai Composite Index [8]. Judging from the cycle position, the stock price is in the
In terms of seasonal characteristics, Flat Glass has historically performed best in March (average price: RMB 23.63), November (average price: RMB 21.88), and January (average price: RMB 21.35); its weakest performance was in August (average price: RMB 17.12), September (average price: RMB 17.43), and July (average price: RMB 17.67) [7]. This characteristic is closely related to the installation rhythm of the photovoltaic industry chain, with the first and fourth quarters usually being peak installation seasons.
Based on the analysis of industry data, we have identified the following cycle inflection point signals:
- Continuous slowdown in capacity growth: New capacity in 2025 decreased by 33% year-on-year, and cold repair capacity remains at a high level [5]
- Accelerated capacity clearing of second-tier enterprises: Some unprofitable or loss-making second and third-tier enterprises are facing survival pressure [2]
- Market share increase of leading enterprises: After dropping from 53% at the end of 2021 to 44% in January 2025, the combined market share of Xinyi Solar and Flat Glass is expected to stabilize and rebound [2]
- Continuous growth of global photovoltaic installations: In 2024, China’s new photovoltaic installations reached 27.8 GW, a year-on-year increase of 28% [3]
- Increased penetration rate of double-glass modules: It is expected that double-glass modules will account for approximately 80% in 2024, driving glass demand [2]
- Seasonal improvement in module production scheduling: Post-holiday module demand entering the peak season is expected to drive a decline in glass inventory [5]
- Periodic price increases of glass occurred in March and August 2025 [5]
- Industry associations stipulate that sales cannot be below cost price, limiting the downward space for prices [5]
Looking ahead to 2026, we hold a
From the perspective of price expectations, glass prices are expected to rise slightly in 2026. Before the Spring Festival, demand on the module side remains weak, and glass is still in the inventory accumulation stage; after the festival, as module demand enters the peak season, glass inventory days will start to decline, and prices are expected to increase slightly [5]. At the same time, if module manufacturers’ profits recover in Q2 2026, their acceptance of upstream price increases is expected to improve, but the magnitude will still be limited [5].
As an industry leader, Flat Glass is expected to fully benefit from the cycle recovery. The company has the following competitive advantages:
- Cost advantage: Self-supply of silica sand, low-energy-consumption large kilns, high yield rate [6]
- Customer advantage: Long-term agreements signed with leading module enterprises such as JinkoSolar and Chint New Energy [6]
- Overseas layout: 2,000 tons/day capacity in Vietnam, and the Indonesian project is progressing as planned [1]
- Financial advantage: AA main credit rating, smooth financing channels [6]
Based on the analysis of cyclical characteristics, we put forward the following investment strategy recommendations:
- Demand improvement brought by the start of module production scheduling around the Spring Festival
- Supply contraction brought by accelerated industry capacity clearing
- Profit improvement brought by periodic glass price increases
- Risk of intensified competition: Second and third-tier enterprises may seize market share through price wars [1]
- Risk of demand falling short of expectations: The growth rate of photovoltaic installations may slow down [1]
- Risk of raw material price fluctuations: Fluctuations in soda ash and natural gas prices affect costs [4]
Flat Glass’s photovoltaic glass business exhibits typical
Looking ahead to 2026, with continuous contraction on the supply side and steady growth on the demand side, the photovoltaic glass industry is expected to gradually move towards supply-demand balance, with room for a slight price increase. As one of the industry’s duopolies, Flat Glass is expected to fully benefit from the cycle recovery, and it is recommended to pay attention to medium- and long-term allocation opportunities brought by cycle inflection points.
[1] Soochow Securities - Flat Glass (601865) 2025 Interim Report Review (http://pdf.dfcfw.com/pdf/H3_AP202508281736134853_1.pdf)
[2] Sinolink Securities - Special Research Report on the Photovoltaic Glass Industry (https://pdf.dfcfw.com/pdf/H301_AP202501141641912365_1.pdf)
[3] China Business Industry Research Institute - 2025 China Photovoltaic Glass Industry Chain Map and Investment Layout Analysis (https://m.thepaper.cn/newsDetail_forward_31987386)
[4] Haizheng Futures - 2026 Soda Ash Market Outlook and Strategy (https://www.hicend.com/ftpfile/static/file/upload/file/202601/04/CQfcnwaaF0SFrBXs.pdf)
[5] CICC (China International Capital Corporation) - 2026 Outlook | PV & Energy Storage: PV Bides Time for Inflection Point, Energy Storage in the Ascendant (https://finance.sina.com.cn/stock/stockzmt/2025-12-26/doc-inheaqmr2648003.shtml)
[6] China Chengxin International - 2025 Annual Tracking Rating Report of Flat Glass Group Co., Ltd. (https://stockn.xueqiu.com/06865/20250523792161.pdf)
[7] Jinling AI - Technical Analysis Data of Flat Glass (601865.SS)
[8] Jinling AI - Real-time Market Data of Flat Glass (601865.SS)
Insights are generated using AI models and historical data for informational purposes only. They do not constitute investment advice or recommendations. Past performance is not indicative of future results.
About us: Ginlix AI is the AI Investment Copilot powered by real data, bridging advanced AI with professional financial databases to provide verifiable, truth-based answers. Please use the chat box below to ask any financial question.