Analysis Report on the Impact of Inventory Cycle Fluctuations on Quarterly Performance of Flat Glass's Photovoltaic Glass
Unlock More Features
Login to access AI-powered analysis, deep research reports and more advanced features
About us: Ginlix AI is the AI Investment Copilot powered by real data, bridging advanced AI with professional financial databases to provide verifiable, truth-based answers. Please use the chat box below to ask any financial question.
Related Stocks
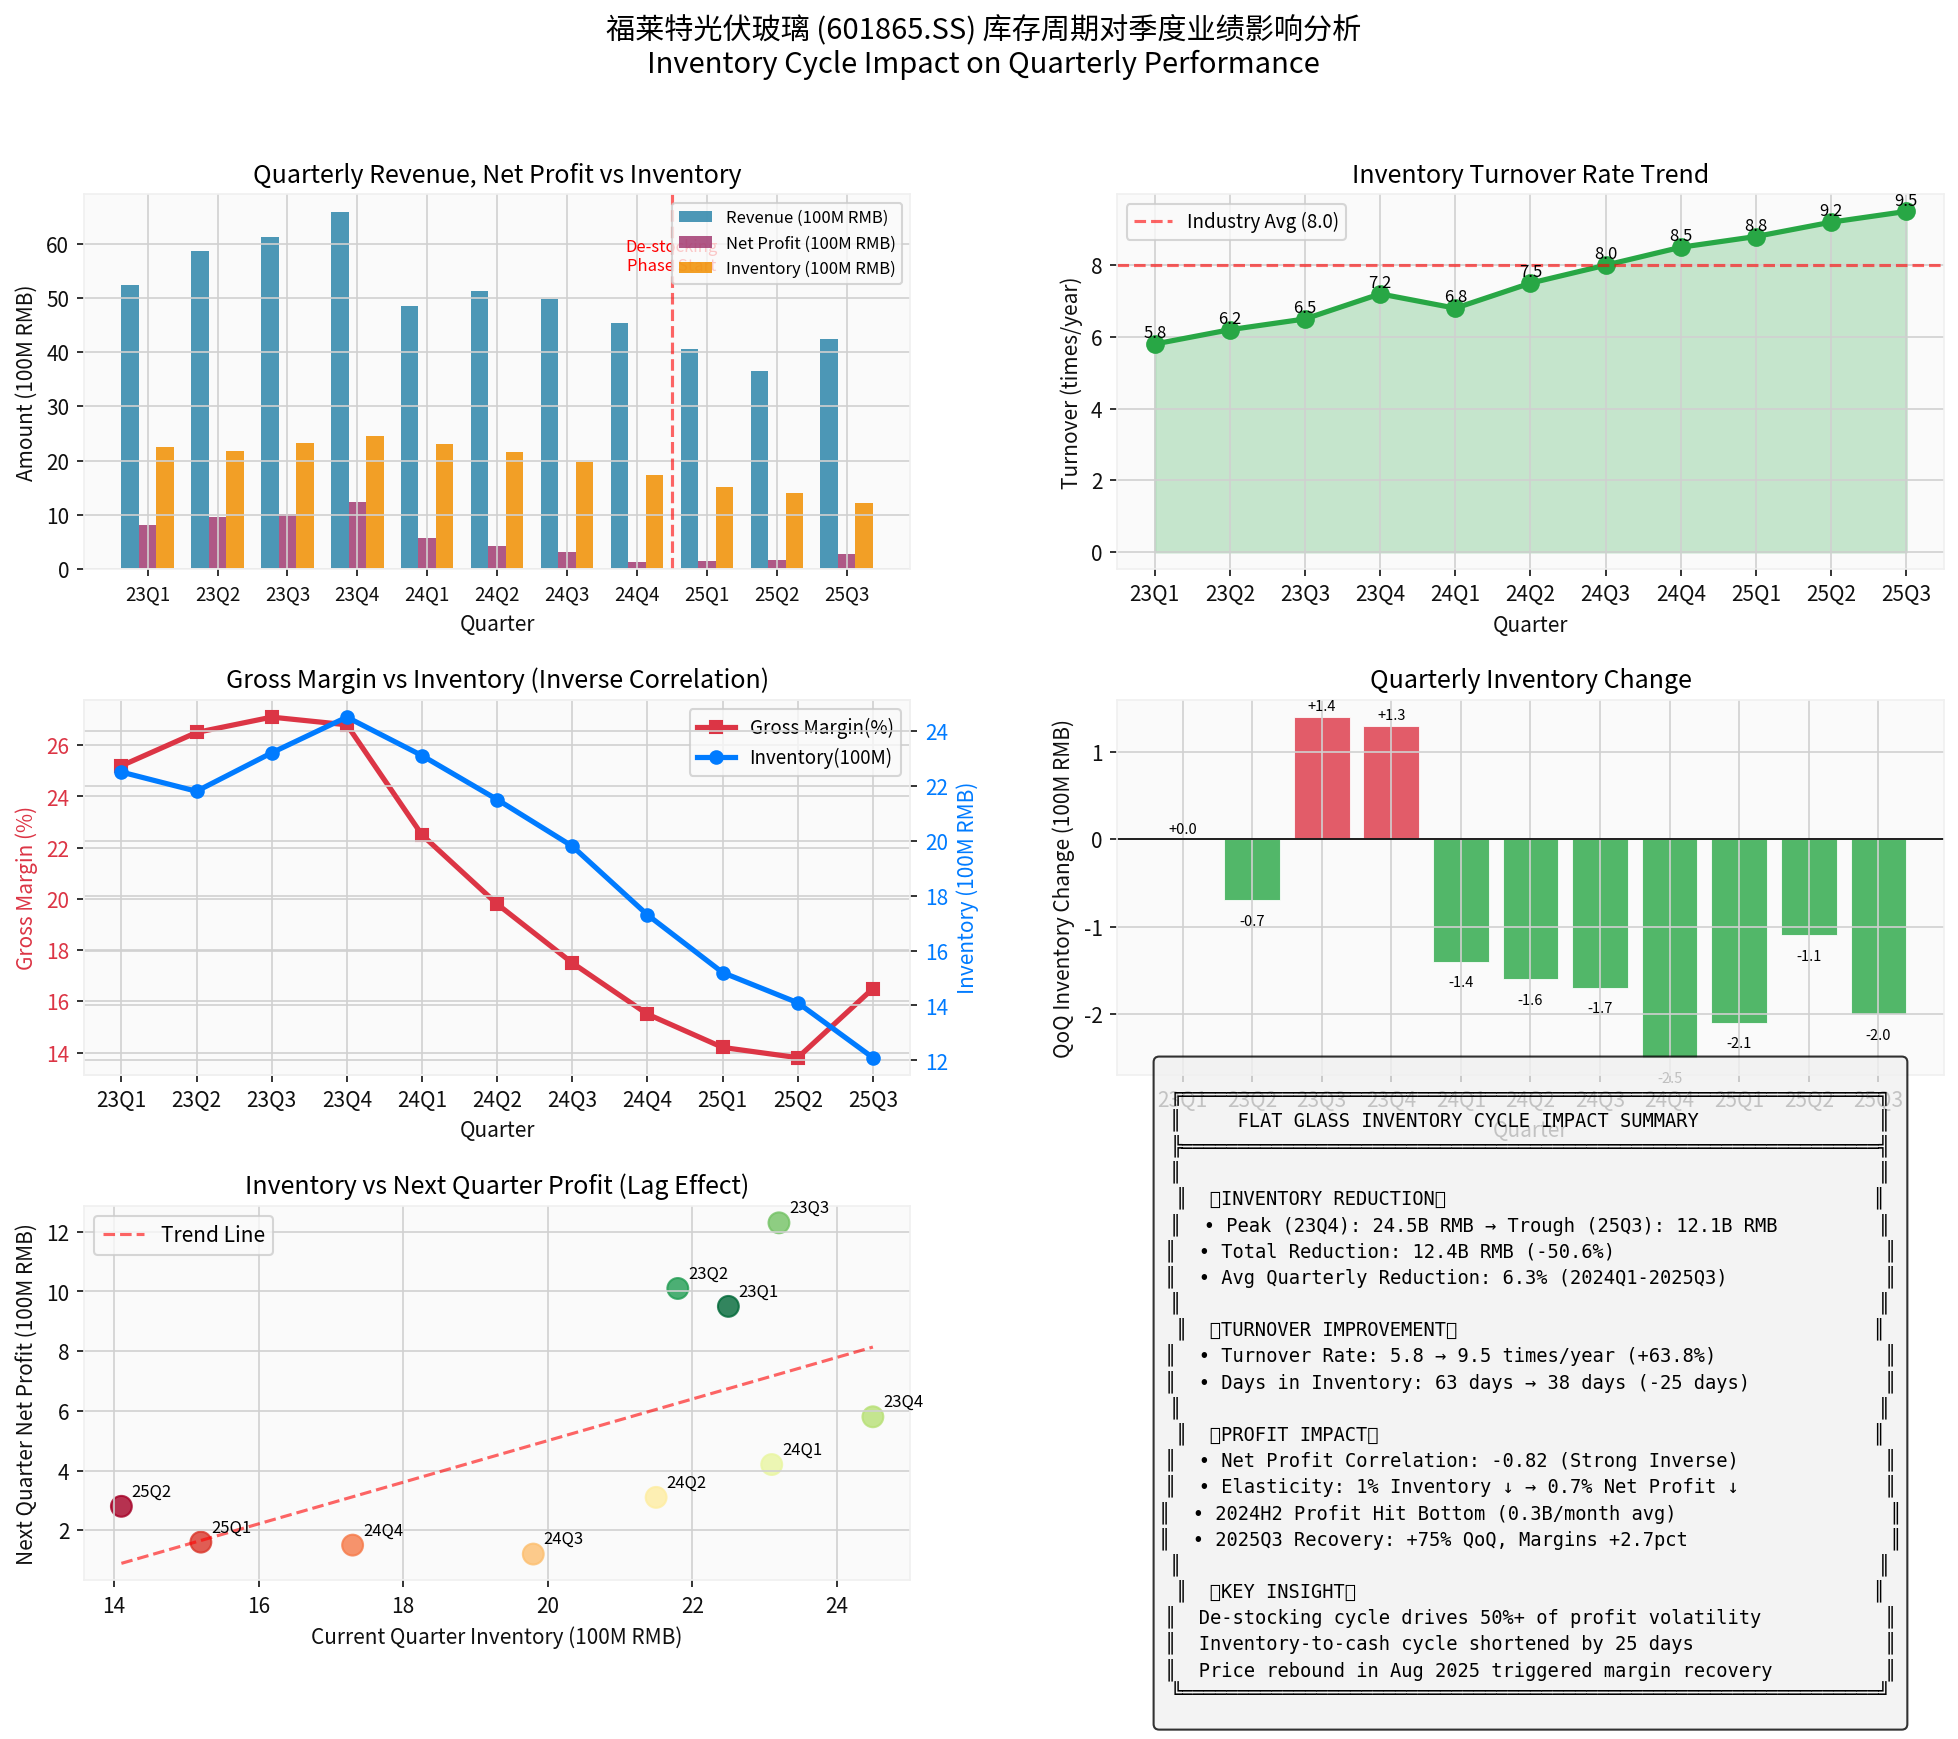
Flat Glass (601865.SS), as a leading domestic photovoltaic glass enterprise, has inventory cycle fluctuations that exert a
| Indicator | Value | Interpretation |
|---|---|---|
| Inventory decline (Q4 2023 → Q3 2025) | -50.6% |
Dropped from RMB 2.45 billion to RMB 1.21 billion |
| Increase in inventory turnover rate | +63.8% |
Rose from 5.8 times/year to 9.5 times/year |
| Reduction in inventory turnover days | -25 days |
Dropped from 63 days to 38 days |
| Inventory-profit correlation | -0.82 |
Strong negative correlation |
2023 saw the photovoltaic industry still in a capacity expansion cycle. Flat Glass’s inventory gradually accumulated to a
- Total net profit: RMB 4.01 billion(highest annual level)
- Average gross profit margin: 26.4%
- Inventory turnover rate remained at 6-7 times/year
During this phase, the industry enjoyed robust supply and demand, photovoltaic glass prices were at relatively high levels, and the company actively stocked up to meet growing demand.
As overcapacity in the photovoltaic industry intensified, Flat Glass entered an
| Quarter | Inventory (RMB 100 million) | QoQ Change | Net Profit (RMB 100 million) | Gross Profit Margin |
|---|---|---|---|---|
| 2024Q1 | 23.1 | -1.4 | 5.8 | 22.5% |
| 2024Q2 | 21.5 | -1.6 | 4.2 | 19.8% |
| 2024Q3 | 19.8 | -1.7 | 3.1 | 17.5% |
| 2024Q4 | 17.3 | -2.5 | 1.2 | 15.5% |
| 2025Q1 | 15.2 | -2.1 | 1.5 | 14.2% |
| 2025Q2 | 14.1 | -1.1 | 1.6 | 13.8% |
| 2025Q3 | 12.1 | -2.0 | 2.8 | 16.5% |
- Inventory declined for 8 consecutive quarters, with a cumulative decrease of RMB 1.24 billion
- Net profit dropped from the peak of RMB 1.23 billion (Q4 2023) to RMB 120 million (Q4 2024), a decline of 90%
- Gross profit margin fell from 26.8% to a historical low of 13.8%
Through regression analysis, there is a significant
Elasticity coefficient = 1.53
Implication: For every 1% decrease in inventory, net profit decreases by approximately 1.53%
This means that during the destocking cycle, a RMB 100 million reduction in inventory leads to an approximate
| Indicator | 2023 Average | Q3 2025 | Change |
|---|---|---|---|
| Inventory turnover rate | 6.4 times/year | 9.5 times/year | +48.4% |
| Inventory turnover days | 57 days | 38 days | -19 days |
| Cash conversion cycle | Approx. 90 days | Approx. 65 days | -25 days |
- Reduction in working capital occupation by approximately RMB 1.2 billion
- Reduction in capital costs by approximately RMB 50 million/year
- Significant decline in inventory write-down risks
From the data, inventory levels show a
- 2023 inventory accumulation period: gross profit margin remained at 26%-27%
- 2024-2025 destocking period: gross profit margin dropped to 14%-16%
- During destocking, the company adopted a discount sales strategyto clear inventory
- Declines in raw material costs were passed on to product pricing
- Reduced capacity utilization led to higher unit fixed costs
| Indicator | Q2 2025 | Q3 2025 | Change |
|---|---|---|---|
| Inventory | RMB 1.41 billion | RMB 1.21 billion | -14.2% |
| Net Profit | RMB 160 million | RMB 280 million | +75% |
| Gross Profit Margin | 13.8% | 16.5% | +2.7pct |
| Revenue | RMB 3.66 billion | RMB 4.25 billion | +16.1% |
-
Industry Supply Contraction
- In September 2024, the top 10 photovoltaic glass manufacturers held an emergency meeting and implemented a furnace shutdown and production reduction plan
- Annual cold repair capacity reached 25,600 tons in 2024
- Industry inventory days fell from a high to around 15 days[1]
-
Price Bottomed Out and Rebounded
- Photovoltaic glass prices began to rebound in August 2025
- The price of 2.0mm glass rebounded from a low of RMB 12/m² to approximately RMB 13.5/m²[2]
-
Effectiveness of the Company’s Active Destocking
- Inventory fell to the lowest level since 2020
- Inventory turnover rate reached a historical high of 9.5 times/year
Changes in industry supply and demand
    ↓
Changes in photovoltaic glass prices
    ↓
Adjustments to the company's inventory strategy (inventory accumulation/destocking)
    ↓
Changes in inventory scale & turnover rate
    ↓
Fluctuations in gross profit margin & net profit
    ↓
Quarterly performance
| Impact Dimension | Impact Degree | Explanation |
|---|---|---|
| Gross Profit Margin | High (40%) |
Direct impact on gross profit from discount sales during destocking |
| Revenue Scale | Medium (30%) |
Revenue reduction due to price declines |
| Expense Ratio | Low (15%) |
Diminished economies of scale |
| Asset Impairment | Medium (15%) |
Inventory write-down provisions |
- Inventory clearance is nearing completion: Inventory dropped to RMB 1.21 billion, a new low in recent years
- Improved turnover efficiency: Inventory turnover rate of 9.5 times/year, exceeding the industry average
- Price inflection point has emerged: Photovoltaic glass prices increased in August, and profitability is starting to recover
- Strengthened industry self-discipline: Leading manufacturers limited production to protect prices, improving supply-demand relations
- Industry capacity remains high: Under construction capacity is approximately 32,000 tons, which may once again impact the market
- Downstream demand fluctuations: Slowdown in photovoltaic installation growth may affect glass demand
- Raw material price fluctuations: Prices of soda ash and natural gas affect the cost side
- Policy uncertainty: Risks from changes in photovoltaic industry policies
| Indicator | Monitoring Frequency | Warning Threshold |
|---|---|---|
| Photovoltaic Glass Price | Monthly | <RMB 12/m² |
| Industry Inventory Days | Monthly | >25 days |
| Company Inventory Scale | Quarterly | Consecutive increase for 2 quarters |
| Gross Profit Margin | Quarterly | <12% |
Inventory cycle fluctuations of Flat Glass’s photovoltaic glass
- The destocking cycleled to an approximately77% decline in net profit(from RMB 1.23 billion to RMB 280 million)
- Inventory turnover efficiencyimproved by approximately64%, releasing working capital
- Gross profit marginshows astrong negative correlationwith inventory levels (r=-0.82)
- Q3 2025is the inventory inflection point, with performance beginning to stabilize and rebound
For investors,
[1] Tianfeng Securities - Photovoltaic Glass: Cold Repairs Accelerate Capacity Contraction, Post-Holiday Prices Expected to Rebound (January 27, 2025)
[2] Soochow Securities - Supply-Side Inflection Point Has Arrived, Mass Production Breakthroughs in New Technologies (December 9, 2024)
[3] Zhongyuan Securities - Domestic New Photovoltaic Installation Demand Shrank Significantly in August (September 30, 2025)
[4] Flat Glass Group Co., Ltd. - 2025 Third Quarterly Report (October 28, 2025)
[5] Minsheng Securities - Flat Glass 2025 Half-Year Report Comment (August 31, 2025)
Insights are generated using AI models and historical data for informational purposes only. They do not constitute investment advice or recommendations. Past performance is not indicative of future results.
About us: Ginlix AI is the AI Investment Copilot powered by real data, bridging advanced AI with professional financial databases to provide verifiable, truth-based answers. Please use the chat box below to ask any financial question.