In-Depth Analysis of Abnormal Stock Price Volatility of Goldwind Technology (002202.SZ)
Unlock More Features
Login to access AI-powered analysis, deep research reports and more advanced features
About us: Ginlix AI is the AI Investment Copilot powered by real data, bridging advanced AI with professional financial databases to provide verifiable, truth-based answers. Please use the chat box below to ask any financial question.
Related Stocks
Goldwind Technology released an abnormal stock price volatility announcement on January 16, 2026. The cumulative deviation of the company’s stock closing price decline over 3 consecutive trading days exceeded 20%, and the stock hit the limit-down board on that day with a decline of 9.99%[1][2]. The company immediately issued a verification announcement, confirming that there is no need to correct or supplement previously disclosed information, there have been no major changes in its recent operations and internal/external environment, and there are no material matters that should be disclosed but have not been disclosed.
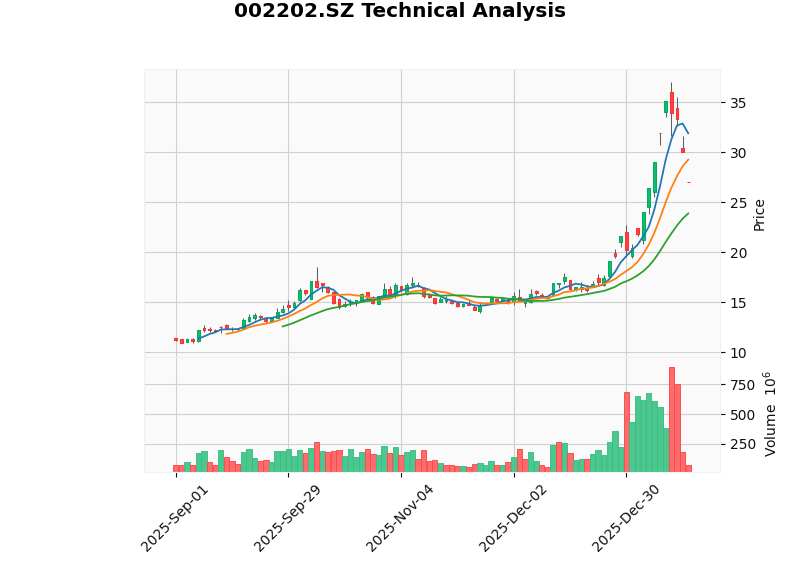
From a technical analysis perspective, this decline exhibits typical characteristics of a
| Technical Indicator | Value | Signal Interpretation |
|---|---|---|
| 6-Month Cumulative Increase | +172.86% | Excessive short-term increase, facing pullback pressure |
| KDJ Indicator | K:64.5, D:79.0, J:35.6 | J value fell rapidly, K line crossed below D line, indicating overbought correction |
| RSI(14) | Normal Range | Has not entered oversold territory |
| 20-Day/50-Day/200-Day Moving Average | 23.90/18.91/12.88 RMB | Stock price remains above all moving averages, trend remains intact |
| Support/Resistance Levels | 23.90-28.18 RMB | Range-bound consolidation pattern |
| Beta Coefficient | 0.68 | Low correlation with the broader market, relatively independent trend |
Although the company stated that “there have been no major changes in internal and external environments”, multiple data points indicate certain pressure on fundamentals:
- Asset-Liability Ratio: 73.11%, at a relatively high level in the industry, with high financial leverage[2]
- Cash Flow Status: Net outflow of 633 million RMB from operating activities in January-September 2025
- Liquidity Indicators: Current ratio of 0.98, quick ratio of 0.70, both below healthy levels
- Profitability: ROE of only 6.81%, net profit margin of 3.84%, weak profitability
- Domestic new bidding volume in January-September 2025 decreased by 14.3% year-on-year
- Average bidding price for wind turbines is approximately 1,610 RMB/kW, with limited profit margins
- Asset-liability ratio of some subsidiaries (such as Goldwind Turkey, Goldwind Saudi Arabia) exceeds 70%
The wind power industry is undergoing a critical transformation from “price war” to “value competition”:
| Time Node | Average Winning Bid Price for Onshore Wind Turbines | Month-on-Month Change |
|---|---|---|
| 2021 | 2,800 RMB/kW | - |
| 2022 | 2,400 RMB/kW | -14.3% |
| 2023 | 1,900 RMB/kW | -20.8% |
| 2024 | 1,400 RMB/kW (Bottom) | -26.3% |
| 2025 | 1,616 RMB/kW | +15.4% |
- During the 2024 Beijing International Wind Energy Conference, 12 wind power companies signed the “Self-Discipline Convention of China’s Wind Power Industry for Maintaining a Fair Market Competition Environment”to restrict vicious bidding behavior[4]
- Winning bid prices for all models in the first half of 2025 are all above the minimum cost line
- Data from industry associations shows that the minimum winning bid price for 6.25-7.15MW units increased from 960 RMB/kW in 2024 to 1,439 RMB/kW in the first half of 2025
| Indicator | 2025 Data | Year-on-Year Change |
|---|---|---|
| Onshore Wind Power Bidding | 88GW (Jan-Nov) | -11% |
| Offshore Wind Power Bidding | 9.4GW (Jan-Nov) | +7% |
| Overseas Orders (7 Complete Machine Manufacturers) | 19.28GW (First Three Quarters) | +187.8% |
- The Beijing Wind Energy Declaration 2.0 proposes that the annual new installed capacity during the “15th Five-Year Plan” period will be no less than 120 million kW
- Cumulative installed capacity targets: 130 million kW by 2030, 200 million kW by 2035, and 500 million kW by 2060
| Valuation Indicator | Value | Position in Industry |
|---|---|---|
| P/E (TTM) | 42.64x | Significantly higher than historical average |
| P/B | 2.95x | Moderately high |
| P/S | 1.65x | Moderate |
| Market Capitalization | 114.2 billion RMB | Industry Leader |
According to forecasts from Tianfeng Securities and Guojin Securities[4][5]:
| Year | Net Profit Attributable to Shareholders (100 million RMB) | Year-on-Year Growth Rate | Forecasted P/E |
|---|---|---|---|
| 2024 | 18.6 | +39.8% | 22.3x |
| 2025E | 33.6 | +80.5% | 12.3x |
| 2026E | 41.5 | +23.7% | 10.0x |
| 2027E | 47.1 | +13.4% | 8.8x |
- Wind Turbine Business Turns Profitable: The company’s turbine manufacturing business is expected to turn profitable in 2025, with delivery prices rebounding
- Overseas Market Volume Expansion: Overseas service revenue exceeded 1.1 billion RMB in the first half of 2025, a year-on-year increase of 348%
- Pattern Optimization: The industry self-discipline convention promotes improvement in the competitive landscape, with market share of leading enterprises increasing
- Intensified Price Competition: If market order deteriorates again, it may lead to a price decline
- Raw Material Fluctuations: Fluctuations in prices of bulk commodities such as steel affect costs
- Overseas Policy Risks: Geopolitical factors may affect overseas expansion
- Decline in Bidding Volume: The 11% decline in onshore wind power bidding in 2025 may affect installed capacity in 2026
| Dimension | Judgment | Basis |
|---|---|---|
Nature of Volatility |
Dominated by technical correction | Excessive previous increase (+172%), KDJ overbought correction |
Fundamentals |
Neutral to cautious | Cash flow under pressure, bidding volume declining, but prices have stabilized and rebounded |
Industry Trend |
New era of value competition | Self-discipline convention signed, price center shifted upward, pattern optimized |
Valuation Level |
Downside potential exists | Current P/E 42.64x vs forecasted P/E 12.3x |
- January 23, 2026: The company will hold a 2025 performance preview communication meeting
- April 23, 2026: Official disclosure of 2025 annual report
- 2026 Wind Turbine Delivery Prices: Key verification indicator for profit inflection point
- Overseas Order Implementation: Delivery progress of 7.16GW of external orders in hand in 2025
| Institution | Rating | Target Price | Rationale |
|---|---|---|---|
| Tianfeng Securities | Buy | 13.51 RMB | 17x P/E for 2025, profit elasticity of turbine manufacturing released |
| Guojin Securities | Buy (Upgraded) | - | Pattern continues to improve, profit elasticity continues to be released |
[1] Sina Finance - Analysis of Goldwind Technology’s Limit-Down on January 16, 2026 (https://finance.sina.com.cn/stock/aiassist/ydfx/2026-01-16/doc-inhhncxc5689037.shtml)
[2] Goldwind Technology Company Announcement - Abnormal Stock Price Volatility Announcement (January 16, 2026)
[3] Gilin AI Technical Analysis Module [0]
[4] Tianfeng Securities Research Report - Initial Coverage Report on Goldwind Technology (002202) (https://pdf.dfcfw.com/pdf/H3_AP202506221695515365_1.pdf)
[5] Guojin Securities Industry Special Report - Continuous Optimization of the Wind Turbine Segment Pattern (https://pdf.dfcfw.com/pdf/H3_AP202512121799086839_1.pdf)
[6] Economic Observer - Wind Power Industry Enters a New Stage of Value Competition (http://www.eeo.com.cn/2025/1022/760655.shtml)
[7] Eastmoney - Wind Power Overseas Expansion Reaps Harvest, Main Machine Prices Rebound Across the Board (https://finance.eastmoney.com/a/202512253601702942.html)
Insights are generated using AI models and historical data for informational purposes only. They do not constitute investment advice or recommendations. Past performance is not indicative of future results.
About us: Ginlix AI is the AI Investment Copilot powered by real data, bridging advanced AI with professional financial databases to provide verifiable, truth-based answers. Please use the chat box below to ask any financial question.