TSMC (TSM) Technical Analysis and HPC Business Evaluation Report
Unlock More Features
Login to access AI-powered analysis, deep research reports and more advanced features
About us: Ginlix AI is the AI Investment Copilot powered by real data, bridging advanced AI with professional financial databases to provide verifiable, truth-based answers. Please use the chat box below to ask any financial question.
Related Stocks
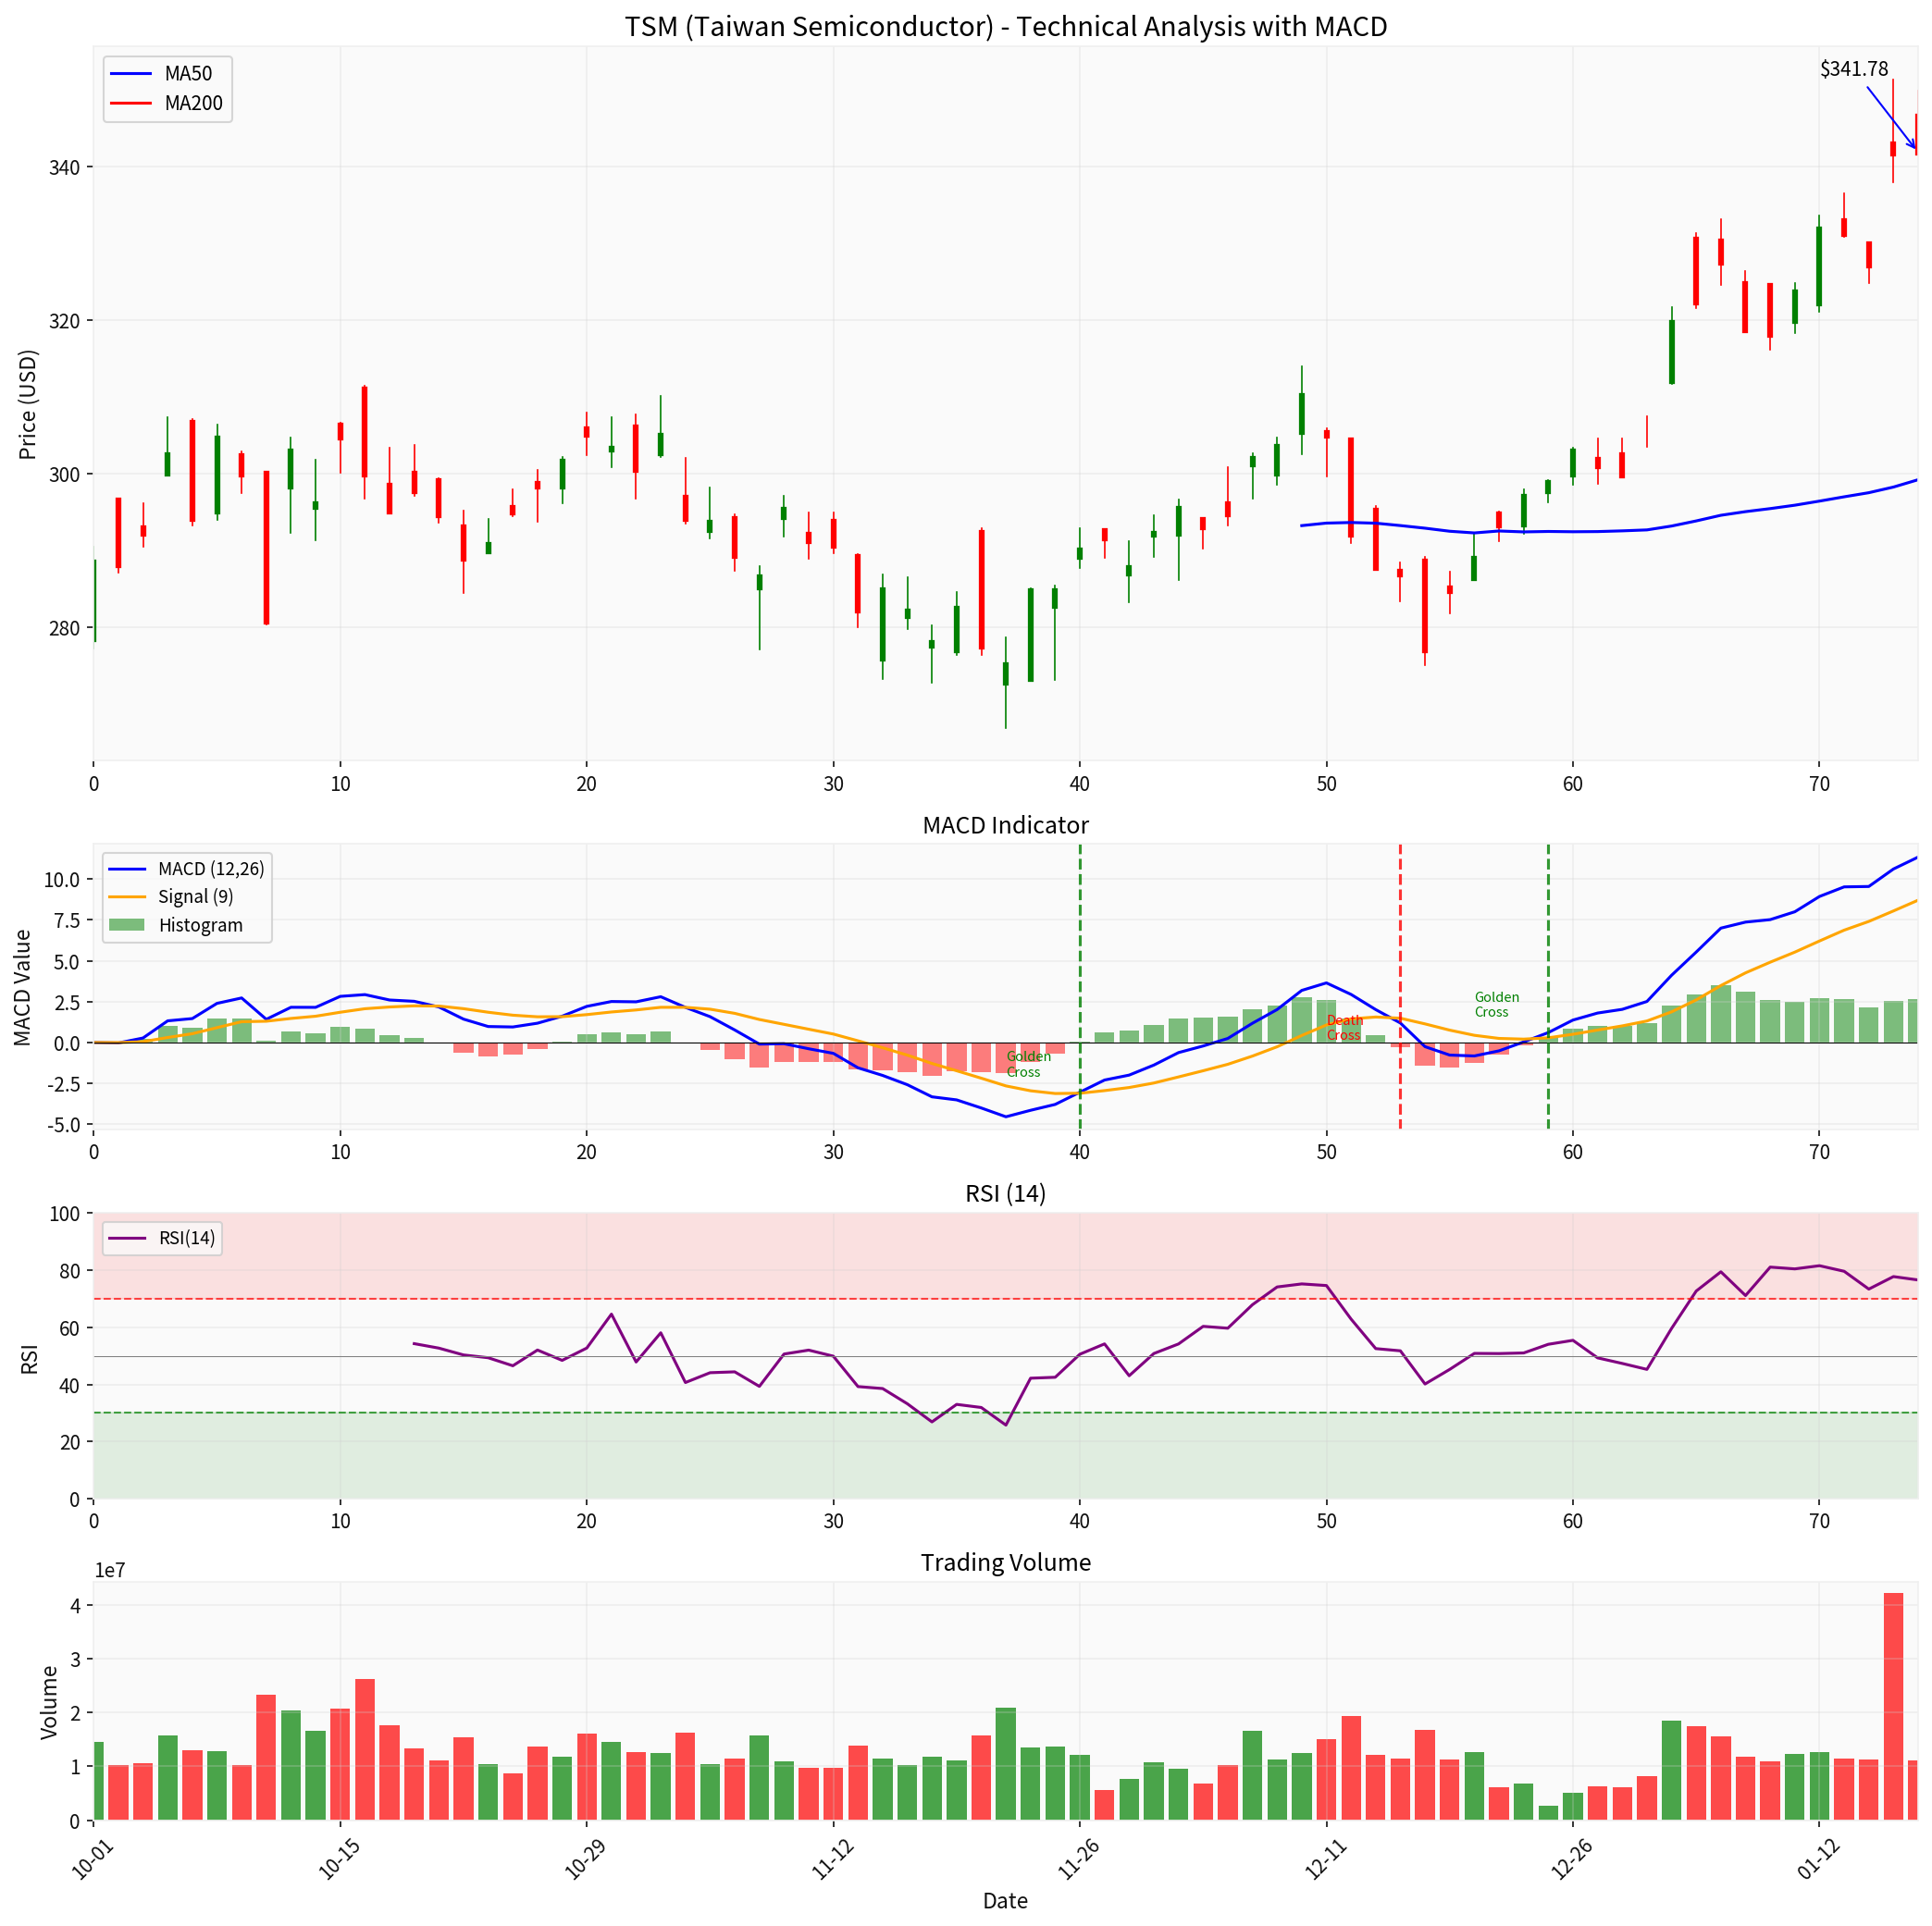
Now I will provide you with a comprehensive technical and fundamental analysis report.
| Indicator | Value | Interpretation |
|---|---|---|
| MACD Line | 11.3344 | Above the Signal Line, indicating bullish momentum |
| Signal Line | 8.7005 | Below the MACD Line, confirming an uptrend |
| MACD Histogram | +2.6339 | Positive value expanding, bullish strength increasing |
| Crossover Status | Golden Cross |
Golden cross formed on December 24, 2025 |
| Signal Type | Date | Price | Subsequent Performance |
|---|---|---|---|
Golden Cross 🟢 |
2025-11-26 | $289.96 | 17.9% increase |
Death Cross 🔴 |
2025-12-16 | $286.87 | Continued to rise after a short pullback |
Golden Cross 🟢 |
2025-12-24 | $298.80 | 14.4% increase |
According to the latest earnings data [1][2]:
| Indicator | Q4 2025 | Q3 2025 | Quarter-over-Quarter Change | 2024 | Year-over-Year Change |
|---|---|---|---|---|---|
HPC Revenue as % of Total |
55% | 53% | +2pp | ~50% | +5pp |
HPC Revenue Quarter-over-Quarter Growth |
+4% | - | +4pp | - | - |
HPC Annual Revenue Growth |
- | - | - | - | +48% |
| Indicator | Data | Industry Position |
|---|---|---|
| Q4 Total Revenue | $33.73 Billion | 20.5% year-over-year growth, hitting an all-time high |
| Gross Margin | 62.3% | 3.3 percentage points year-over-year increase |
| AI/HPC as % of Revenue | 58% | Approximately $7.1 Billion in annual revenue |
| 2026 Revenue Guidance | +30% YoY | Slightly higher than 2025’s 31.6% |
-
Base Effect: The HPC business experienced explosive growth from 2024 to 2025 (+74% YoY in Q2 2025) [3], and the current growth slowdown is a normal phenomenon after a larger base.
-
Absolute Growth: The HPC business grew48%for the full year 2025, and its proportion increased from approximately 50% in 2024 to58%, indicating that HPC remains the core growth driver.
-
Management Confidence: CEO C.C. Wei stated on the earnings call:
“We have rigorously verified the authenticity of AI demand, and conversations with our customers and their end customers are satisfactory.”
“AI is still in the early stages, and we expect AI accelerator revenue to maintain a 57% compound annual growth rate through 2029.”[2]
- CapEx Validation: 2026 capital expenditure guidance is$5.2-56.0 Billion(30% increase from 2025), indicating management’s strong confidence in medium- to long-term demand [1].
| Dimension | Signal | Strength |
|---|---|---|
MACD |
Golden cross state, bullish alignment | 🟢 Bullish |
Price Position |
Above MA50 ($299), approaching MA200 ($351) | 🟡 Neutral-Bullish |
RSI |
76.58 (Overbought Zone) | 🔴 Short-Term Risk |
Fundamentals |
Revenue growth +30%, increasing HPC proportion | 🟢 Bullish |
Analyst Ratings |
70% Buy, average target price $405 | 🟢 Bullish |
-
Clear bullish MACD signal: Currently in a bullish pattern after the golden cross, with a cumulative increase of over 14% since the golden cross on December 24, 2025, showing strong upward momentum [0].
-
Growth slowdown is expected: Analysts generally expect 2026 revenue growth to slightly decline from 31.6% to approximately 30%, which is a normal slowdown under a high base, not a demand inflection point [1].
-
HPC remains the growth engine: Although the year-over-year growth rate has retreated from its peak,the absolute value is still expanding, and its proportion continues to rise to over 55%.
-
Valuation still has support: The current P/E ratio is 28.4x, below the historical average, and the average analyst target price of $405 implies approximately 18% upside potential [4].
- Short-term overbought risk: RSI(14) = 76.58, caution against technical pullbacks
- Elevated valuation: Only 2.8% below the 52-week high of $351.33
- Macro uncertainty: Monitor the sustainability of AI capital expenditures
| Scenario | Recommendation |
|---|---|
Holders |
Hold primarily, closely monitor performance at the $351 resistance level |
Non-holders |
Consider entering positions on a pullback to the $313-320 support zone |
Risk-averse investors |
Wait for RSI to fall below 60 or a breakout above $351 before entering |
[0] Jinling AI - TSM Real-Time Quotes and Technical Analysis Data (2026-01-16)
[1] Benzinga - “Taiwan Semiconductor Analysts Raise Their Forecasts After Q4 Earnings” (2026-01-16)
[2] MBI Deep Dives - “TSMC’s Green Signal” (2026-01-16)
[3] Seeking Alpha - TSMC HPC Revenue Analysis Chart (2025-10)
[4] Jinling AI - TSM Company Profile and Analyst Ratings (2026-01-16)
Insights are generated using AI models and historical data for informational purposes only. They do not constitute investment advice or recommendations. Past performance is not indicative of future results.
About us: Ginlix AI is the AI Investment Copilot powered by real data, bridging advanced AI with professional financial databases to provide verifiable, truth-based answers. Please use the chat box below to ask any financial question.