Assessment of the Impact of Geopolitical Risks on Investment Strategies for Energy and Defense Stocks
Unlock More Features
Login to access AI-powered analysis, deep research reports and more advanced features
About us: Ginlix AI is the AI Investment Copilot powered by real data, bridging advanced AI with professional financial databases to provide verifiable, truth-based answers. Please use the chat box below to ask any financial question.
Related Stocks
Based on the above market data, news information, and real-time analysis, I will provide you with a comprehensive assessment report on
Tensions in the Middle East continue to escalate, with domestic unrest in Iran intertwined with external military threats, making the region the focus of global geopolitical risks in early 2026 [1]. According to the latest reports, the Kremlin stated that Putin is mediating the Iran situation in an attempt to de-escalate tensions [2]. This diplomatic effort reflects the high level of attention from multiple forces on the stability of the region.
The key risk point of the Iran crisis lies in the strategic importance of its geographical location – the
However, analysts generally believe that a complete closure of the strait is almost impossible due to the presence of US naval forces in the region. The current market does not take “complete closure” as a base case, and instead tends to expect limited disruptions or attacks [1].
Despite frequent geopolitical events, global stock markets have shown significant resilience:
- U.S. Stocks: The S&P 500 has risen approximately 1.5% year-to-date, the Dow Jones Industrial Average has risen nearly 3%, and the Nasdaq Composite has risen 1.2% [3]
- European Stocks: The STOXX Europe 600 has risen nearly 4%
- Asia-Pacific Stocks: The MSCI Asia Pacific Index has risen over 5%, with the Nikkei 225 and KOSPI both hitting all-time highs
The core reason for the market’s muted response to geopolitical risks is that the events have not impacted economic fundamentals, investors have developed “immunity”, and are more focused on interest rates, growth, corporate earnings, and Trump’s economic agenda [3].
Affected by geopolitical risks, international oil prices have seen increased volatility recently:
- Brent Crude: Hit a 2026 high of $64/bbl, last traded at $64.21/bbl, up 1.8% intraday [1][4]
- WTI Crude: Broke through $59/bbl, last traded at $60.09/bbl, up approximately 2.1% intraday [4]
The rise in oil prices stems from market concerns about supply disruptions, but analysts emphasize that the market is currently only pricing in uncertainty, not a “large-scale supply disruption” scenario. If the strait were to close, oil prices could surge by $10-$20 per barrel; even with limited disruptions, prices could rise by several dollars per barrel [1].
| Ticker | Company Name | Market Cap | Current Price | 1-Month Performance | 3-Month Performance | Year-to-Date |
|---|---|---|---|---|---|---|
| XOM | Exxon Mobil | $544.56B | $129.13 | +12.60% | +16.71% | +5.28% |
| CVX | Chevron | - | - | - | - | - |
| COP | ConocoPhillips | - | - | - | - | - |
| SLB | Schlumberger | - | - | - | - | - |
- Profitability: P/E ratio of 18.67x, ROE of 11.42%, net profit margin of 9.22%
- Cash Flow: EV/OCF of 11.12x, indicating healthy cash generation capability
- Analyst Consensus: Target price of $142.00, representing 10% upside from current price, rating “Hold”
- Earnings Expectation: Q4 earnings to be released on January 30, 2026, expected EPS of $1.65
| Risk Type | Score (1-10) | Impact Analysis |
|---|---|---|
| Supply Chain Disruption Risk | 7.5 | Disruptions to the Strait of Hormuz will directly impact Middle East oil shipments |
| Demand Uncertainty | 6.0 | Slowing global economic growth may offset geopolitical risk premiums |
| Policy Uncertainty | 8.0 | Variables exist in U.S. policy towards Iran and OPEC+ production decisions |
| Market Volatility | 7.0 | Geopolitical events drive increased short-term volatility |
The defense sector has a solid structural growth outlook in 2026, with
| Ticker | Company Name | Market Cap | Current Price | 1-Month Performance | 3-Month Performance | Year-to-Date | Analyst Rating |
|---|---|---|---|---|---|---|---|
| LMT | Lockheed Martin | $134.92B | $577.89 | +21.14% | +17.16% | +16.26% | Buy |
| NOC | Northrop Grumman | - | - | - | - | - | - |
| RTX | RTX Corporation | - | - | - | - | - | - |
| BA | Boeing | - | - | - | - | - | - |
- Earnings Beat Expectations: Q3 FY2025 EPS $6.95 vs. expected $6.38, beating expectations by 8.93%; revenue of $18.61B in line with expectations
- Order Momentum: Recently awarded a $9.8B PAC-3 MSE missile contract, with production ramping up to 2,000 units per year
- Production Recovery: Delivered a record 191 F-35 fighter jets in 2025, restoring investor confidence
- Regional Revenue: Europe 38.8%, Asia-Pacific 38.7%, Middle East 12.2%
- Analyst View: Truist Securities recently upgraded to “Buy” with a target price of $605 [7]
| Risk Type | Score (1-10) | Impact Analysis |
|---|---|---|
| Supply Chain Disruption Risk | 6.0 | Raw material and component supplies may be affected by international developments |
| Demand Certainty | 8.5 | Escalating geopolitical conflicts will directly increase defense demand |
| Policy Uncertainty | 7.5 | Variables exist in government budgets and arms sales policies |
| Market Volatility | 5.5 | Relatively defensive, with lower volatility than energy stocks |
| Dimension | Energy Stocks | Defense Stocks |
|---|---|---|
Geopolitical Risk Sensitivity |
High (supply disruption risk) | Medium-High (expected demand increase) |
Price Drivers |
Oil prices, geopolitical events | Defense budgets, regional conflicts |
Valuation Level |
XOM P/E: 18.67x | LMT P/E: 31.91x |
Cash Flow Characteristics |
Highly cyclical | Relatively stable contract-based revenue |
Current Market Sentiment |
Wait-and-see (awaiting clarity on the situation) | Positive (expected order growth) |
Historical data shows that the impact of geopolitical events on stock markets is usually
Energy stocks usually
- Cautious Long Position: If tensions in the Strait of Hormuz escalate, consider phased allocation to industry leaders such as XOM and CVX
- Volatility Trading: Use geopolitical event-driven oil price volatility for range-bound trading
- Risk Hedging: Consider buying out-of-the-money call options to protect long positions
- Buy on Dips: Pullbacks in leading stocks such as LMT are opportunities to add to positions
- Focus on Orders: Prioritize tracking high-value order dynamics such as PAC-3 missiles and F-35s
- Core Position: XOM as a core allocation in the energy sector (current price is attractive, analyst target price $142)
- Diversified Holdings: Pair with non-Middle East exposure targets such as COP (shale oil)
- Valuation Consideration: Current P/E of 18.67x is within a historically reasonable range
- Core Allocation: LMT as the cornerstone of the defense sector (beneficiary of the $1.5 trillion FY2027 budget)
- Diversified Allocation: RTX (missile systems), NOC (aerospace), etc.
- Growth Expectations: F-35 production recovery and PAC-3 order growth provide performance support
- Option Protection: Buy out-of-the-money put options on energy stocks to hedge against downside risks from conflicts
- Gold Hedging: Allocate to gold ETFs such as SPDR Gold Trust to address extreme geopolitical risks
- Diversified Investment: Avoid overconcentration in a single sector, maintain a balance between stocks and bonds
| Indicator | Threshold | Action Recommendation |
|---|---|---|
| Brent Crude Oil Price | >$70/bbl | Reduce energy stock positions to lock in profits |
| Strait of Hormuz Events | Actual Conflict | Significantly increase energy stock positions |
| LMT Orders | Large New Orders Increase | Add to defense stock positions |
| U.S. Defense Budget | Exceeds Expectations | Add to defense stock positions |
| Iran Situation De-escalation | Peace Signals | Reduce energy stock positions |
Against the current geopolitical landscape,
- Energy Stocks: Driven by supply risk premiums, but highly dependent on the evolution of actual conflicts; current market pricing is relatively rational, and range-bound trading is recommended instead of one-way bets
- Defense Stocks: Benefit from structural budget growth and the long-term trend of geopolitical conflicts, with strong fundamental support from the combination of F-35 production recovery and increasing missile orders
[1] OilPrice - “Iran Turmoil Resurrects Specter of Critical Oil Lane Disruption” (https://oilprice.com/Energy/Crude-Oil/Iran-Turmoil-Resurrects-Specter-of-Critical-Oil-Lane-Disruption.html)
[2] Times of India - “Iran Protests Live Updates: US carrier strike group heads for Middle East” (https://timesofindia.indiatimes.com/world/middle-east/iran-protests-2026-news-live-updates-tehran-airspace-ayatollah-ali-khamenei-death-toll-us-tensions-donald-trump/liveblog/126537206.cms)
[3] CNBC - “Why stocks aren’t fazed by Iran, Greenland or Venezuela” (https://www.cnbc.com/2026/01/16/trump-sp-500-iran-greenland-venezuela-geopolitics.html)
[4] Anadolu Agency - “Oil prices rise on reduced risk of near-term Iran conflict” (https://www.aa.com.tr/en/energy/oil/oil-prices-rise-on-reduced-risk-of-near-term-iran-conflict/54086)
[5] Jinling API - Exxon Mobil Corporation Company Profile Data
[6] Nasdaq - “2026 Market Outlook: 3 Top Sectors to Watch Amid Global Tensions” (https://www.nasdaq.com/articles/2026-market-outlook-3-top-sectors-watch-amid-global-tensions)
[7] Investing.com - “3 Stock Market Plays for a Defensive 2026—And 1 Play to Avoid” (https://www.investing.com/analysis/3-stock-market-plays-for-a-defensive-2026and-1-play-to-avoid-200673371)
[8] Jinling API - Lockheed Martin Corporation Company Profile Data
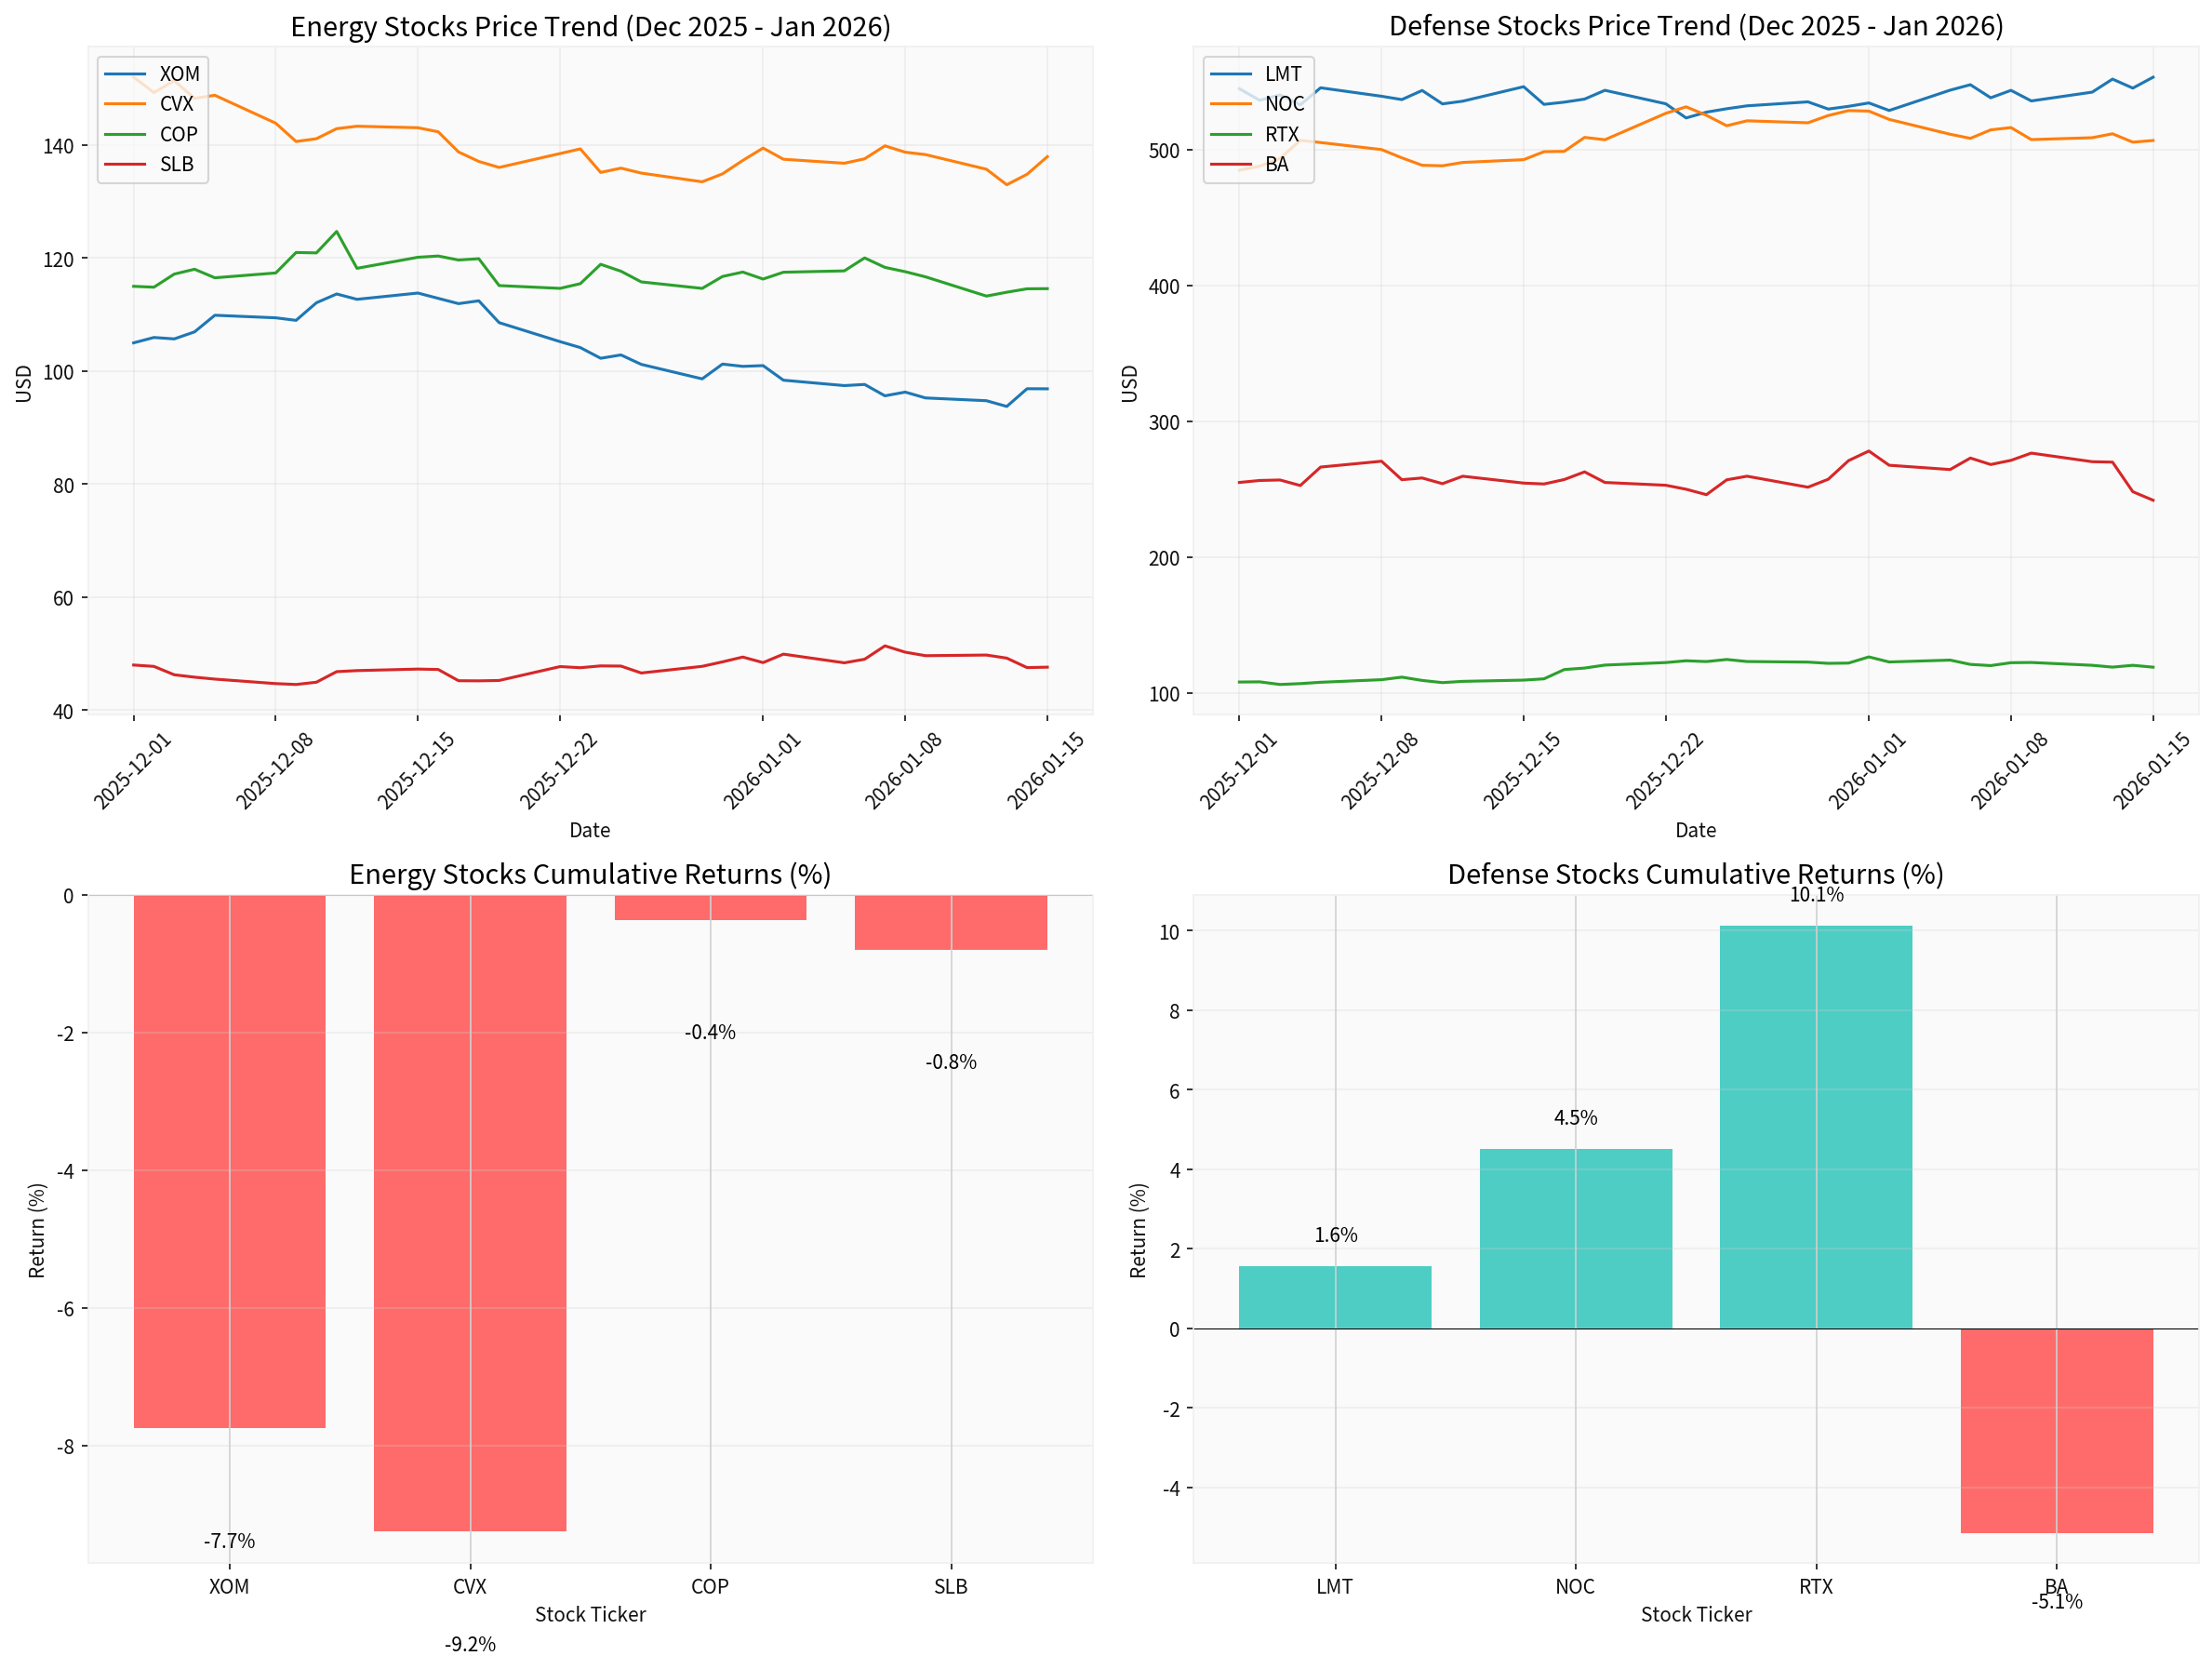
The chart above shows the performance comparison and cumulative return analysis of energy and defense stocks from December 2025 to January 2026, including:
- Price trends of energy stocks (XOM, CVX, COP, SLB)
- Price trends of defense stocks (LMT, NOC, RTX, BA)
- Cumulative return comparison of energy stocks
- Cumulative return comparison of defense stocks
[0] Jinling API Market Data
Insights are generated using AI models and historical data for informational purposes only. They do not constitute investment advice or recommendations. Past performance is not indicative of future results.
About us: Ginlix AI is the AI Investment Copilot powered by real data, bridging advanced AI with professional financial databases to provide verifiable, truth-based answers. Please use the chat box below to ask any financial question.