In-Depth Analysis of TSMC's R&D Investment and Technological Leadership
Unlock More Features
Login to access AI-powered analysis, deep research reports and more advanced features
About us: Ginlix AI is the AI Investment Copilot powered by real data, bridging advanced AI with professional financial databases to provide verifiable, truth-based answers. Please use the chat box below to ask any financial question.
Related Stocks
Based on the latest data and market research, I conducted a systematic analysis of TSMC’s R&D investment status and the sustainability of its technological leadership. Below are the detailed research conclusions:
| Indicator | 2024 Data | Trend Analysis |
|---|---|---|
R&D Expenditure |
US$6.355 billion (approx. NT$194.4 billion) | YoY +12%, a record high |
Proportion of Revenue |
7.1% | Decreased from approx. 8.5% in 2023 |
Five-Year Cumulative R&D Investment |
Approx. US$30 billion | Covers R&D of advanced processes including 14Å, 16Å, and 2nm |
TSMC adopts a dual-drive strategy of “R&D + Capital Expenditure”:
- Five-Year Cumulative Capital Expenditure: US$167 billion
- 2025 Capital Expenditure: US$40.9 billion (YoY +37%)
- Planned 2026 Capital Expenditure: US$52-56 billion
- R&D to Capital Expenditure Ratio: Approx. 15-17% (R&D investment continues to provide technical support for capital expenditure)
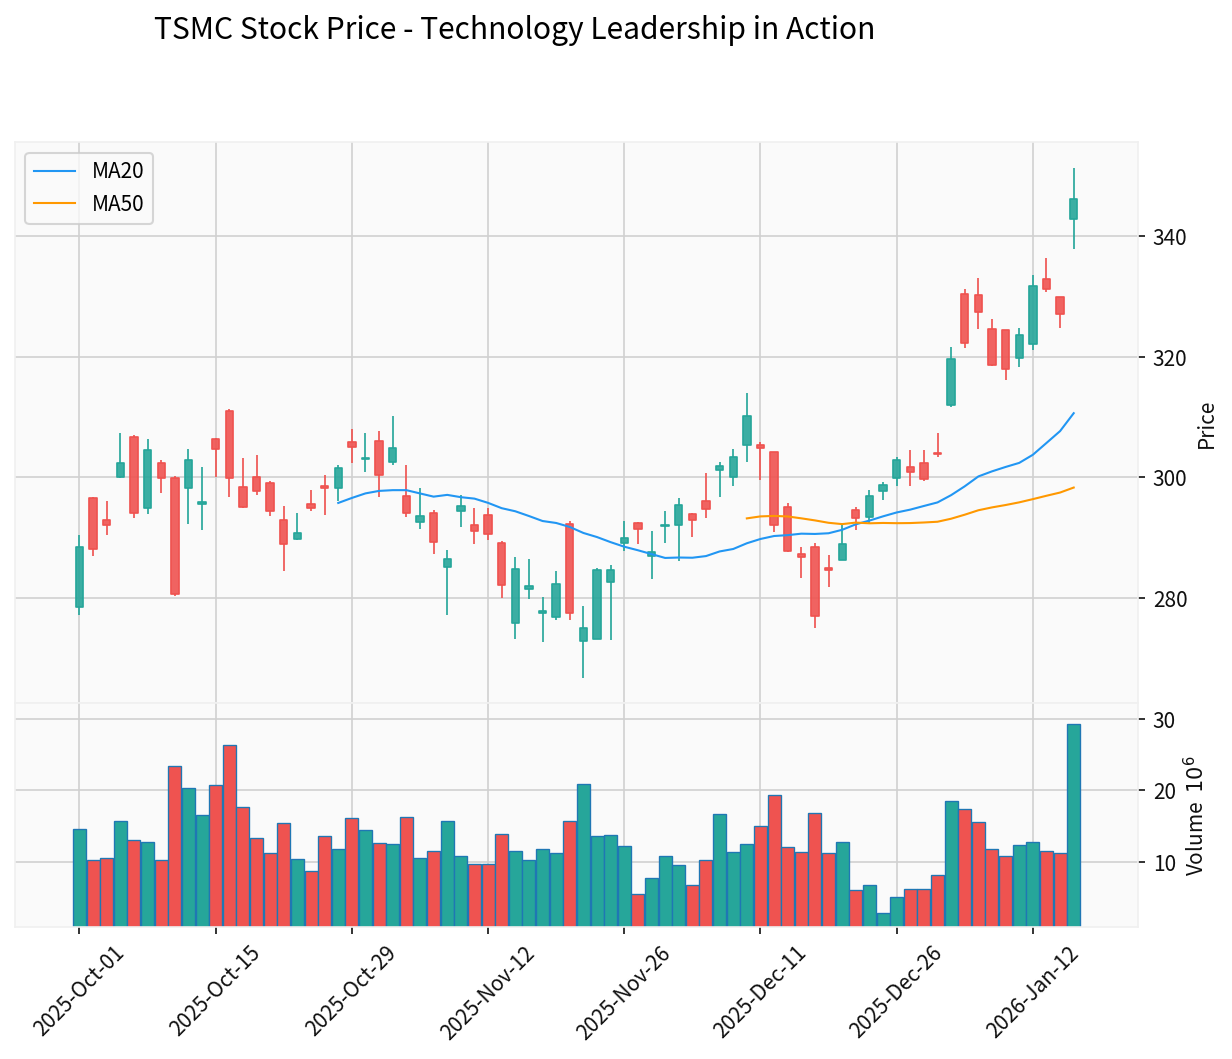
The chart above shows that TSMC’s stock price has risen by approximately 20% since October 2025, with the current price at $346.23, far exceeding the 50-day moving average ($298.32), showing a strong upward trend[0].
| Technology Node | Revenue Share | Strategic Significance |
|---|---|---|
5nm |
35% | Core revenue source |
3nm |
28% | Second-largest revenue source, fastest growth |
7nm |
14% | Mature yet still competitive |
Total Advanced Processes (≤7nm) |
77% |
Significantly increased from 69% in 2024 |
- Mass Production Timeline: Small-scale mass production began at the end of 2025, with large-scale ramp-up in 2026
- Technical Architecture: Adopts Gate-All-Around (GAA) transistor architecture
- Performance Improvement: 15-20% performance increase and 25-30% power reduction compared to 3nm
- First Batch of Customers: Mobile chip demand from Apple, Qualcomm, etc. will migrate to the 2nm platform
- Global Market Share: TSMC provides packaging for over 90% of AI chips
- Capacity Expansion: Monthly capacity of approx. 70,000 wafers in 2025, expected to expand to 120,000 wafers by the end of 2026
- Customer Coverage: Highly relied on by AI chip giants such as NVIDIA, AMD, and Broadcom
- Strategic Value: CoWoS capacity allocation directly affects AI chip shipment volumes, making TSMC a “critical bottleneck node” in the AI industry chain[4].
| Advantage Area | Specific Performance |
|---|---|
Leading Technology Density |
TSMC’s N3P transistor density reaches 294 MTr/mm², leading Samsung/Intel’s approx. 250 MTr/mm² |
Yield Advantage |
TSMC’s yield for mature processes is significantly higher than that of competitors |
Customer Ecosystem |
Aggregates global top chip design companies such as Apple, NVIDIA, AMD, Qualcomm, and Broadcom |
Capital Expenditure Scale |
Planned 2026 capital expenditure of US$52-56 billion, far exceeding the foundry business investment of Samsung and Intel |
Sustained R&D |
Cumulative R&D investment of US$30 billion over the past 5 years, with over 100,000 global patents |
| Risk Type | Specific Details |
|---|---|
Samsung’s Catch-Up |
The yield of Samsung’s 2nm process has increased from 50% to 70%, and the company is turning from loss to profit |
Intel’s Competition |
Intel’s 18A (1.8nm) has begun small-scale mass production, and is expected to gain market share in 2026 |
Geopolitics |
U.S. chip restriction policies against China may impact revenue from the Chinese market (China region accounts for approx. 9% of revenue) |
Decline in R&D Proportion |
The proportion of R&D investment to revenue decreased from 8.1% in 2020 to 7.1% in 2024 |
| Indicator | TSMC | Samsung | Intel | SMIC |
|---|---|---|---|---|
Global Foundry Market Share |
62.3% | 6.8% | 4.0% | 5.5% |
Latest Process Node |
2nm (mass production in 2026) | 2nm | 18A (1.8nm) | 14nm |
Transistor Density |
294 MTr/mm² | ~250 MTr/mm² | ~250 MTr/mm² | ~100 MTr/mm² |
AI Chip Capacity |
Dominant position | Niche | Catching up | Restricted |
- Current Stock Price: $346.23 (January 15, 2026)
- Market Capitalization: US$1.79 trillion
- Price-to-Earnings Ratio (TTM): 27.62x
- 2026 Earnings Forecast: Approx. 22x P/E (based on expected 30% YoY revenue growth)
- Analyst Target Price: $377.50 (9.2% upside potential)
- Rating: 72.7% of analysts give a “Buy” rating[0]
- Trend: Upward trend (breakout pattern, to be confirmed)
- MACD: Bullish alignment, no death cross signal
- KDJ: K-value 78.2, D-value 77.0, buy signal
- RSI: In overbought territory (overbought_risk)
- Key Resistance Levels: $351.33 → $360.98
- Support Level: $326.59[0]
- Leading Mass Production of 2nm: Although Samsung and Intel have entered the 2nm/1.8nm node, there are still gaps in transistor density and yield
- Monopoly in Advanced Packaging: The leading advantage of CoWoS packaging technology will be maintained for at least 2-3 years
- Strong Customer Stickiness: Top AI chip manufacturers are deeply tied to TSMC’s production capacity
- Scale of Capital Expenditure: TSMC’s capital expenditure scale is several times that of its competitors
[1] TechSoda - TSMC 2024 Annual Report Highlights (https://techsoda.substack.com/p/explainer-tsmcs-2024-annual-report)
[2] TSMC Business Overview 2024 - Official Annual Report (https://investor.tsmc.com/sites/ir/annual-report/2024/2024 Business Overview_0.pdf)
[3] Data Center Dynamics - TSMC announces 2026 capex spend of $56bn (https://www.datacenterdynamics.com/en/news/tsmc-announces-2026-capex-spend-of-56bn-after-posting-eighth-consecutive-quarter-of-growth/)
[4] Sina Finance - TSMC: The “Real Big Shot” in AI, Who Would Reject It? (https://finance.sina.com.cn/stock/relnews/us/2026-01-15/doc-inhhkwcm7519826.shtml)
[5] Semiconductor Industry Observer - 84.8 Billion, AI Drives Record Semiconductor Foundry Business (https://zhuanlan.zhihu.com/p/1986863621234508990)
[6] 36Kr - Can’t Beat TSMC, What to Do? (https://m.36kr.com/p/3604769288684547)
[7] LinkedIn - TSMC’s R&D Expenses Reach Record High in 2024 (https://www.linkedin.com/posts/erudite-asia_台湾半导体龙头-台积电研发费用19)
Insights are generated using AI models and historical data for informational purposes only. They do not constitute investment advice or recommendations. Past performance is not indicative of future results.
About us: Ginlix AI is the AI Investment Copilot powered by real data, bridging advanced AI with professional financial databases to provide verifiable, truth-based answers. Please use the chat box below to ask any financial question.