TSMC's AI-Driven Growth Trajectory: Impact on Semiconductor Sector Valuations and Investor Allocation Strategies
Unlock More Features
Login to access AI-powered analysis, deep research reports and more advanced features
About us: Ginlix AI is the AI Investment Copilot powered by real data, bridging advanced AI with professional financial databases to provide verifiable, truth-based answers. Please use the chat box below to ask any financial question.
Related Stocks
Based on my comprehensive analysis of TSMC’s AI-driven growth trajectory and its implications for the semiconductor sector, I will now provide a detailed report.
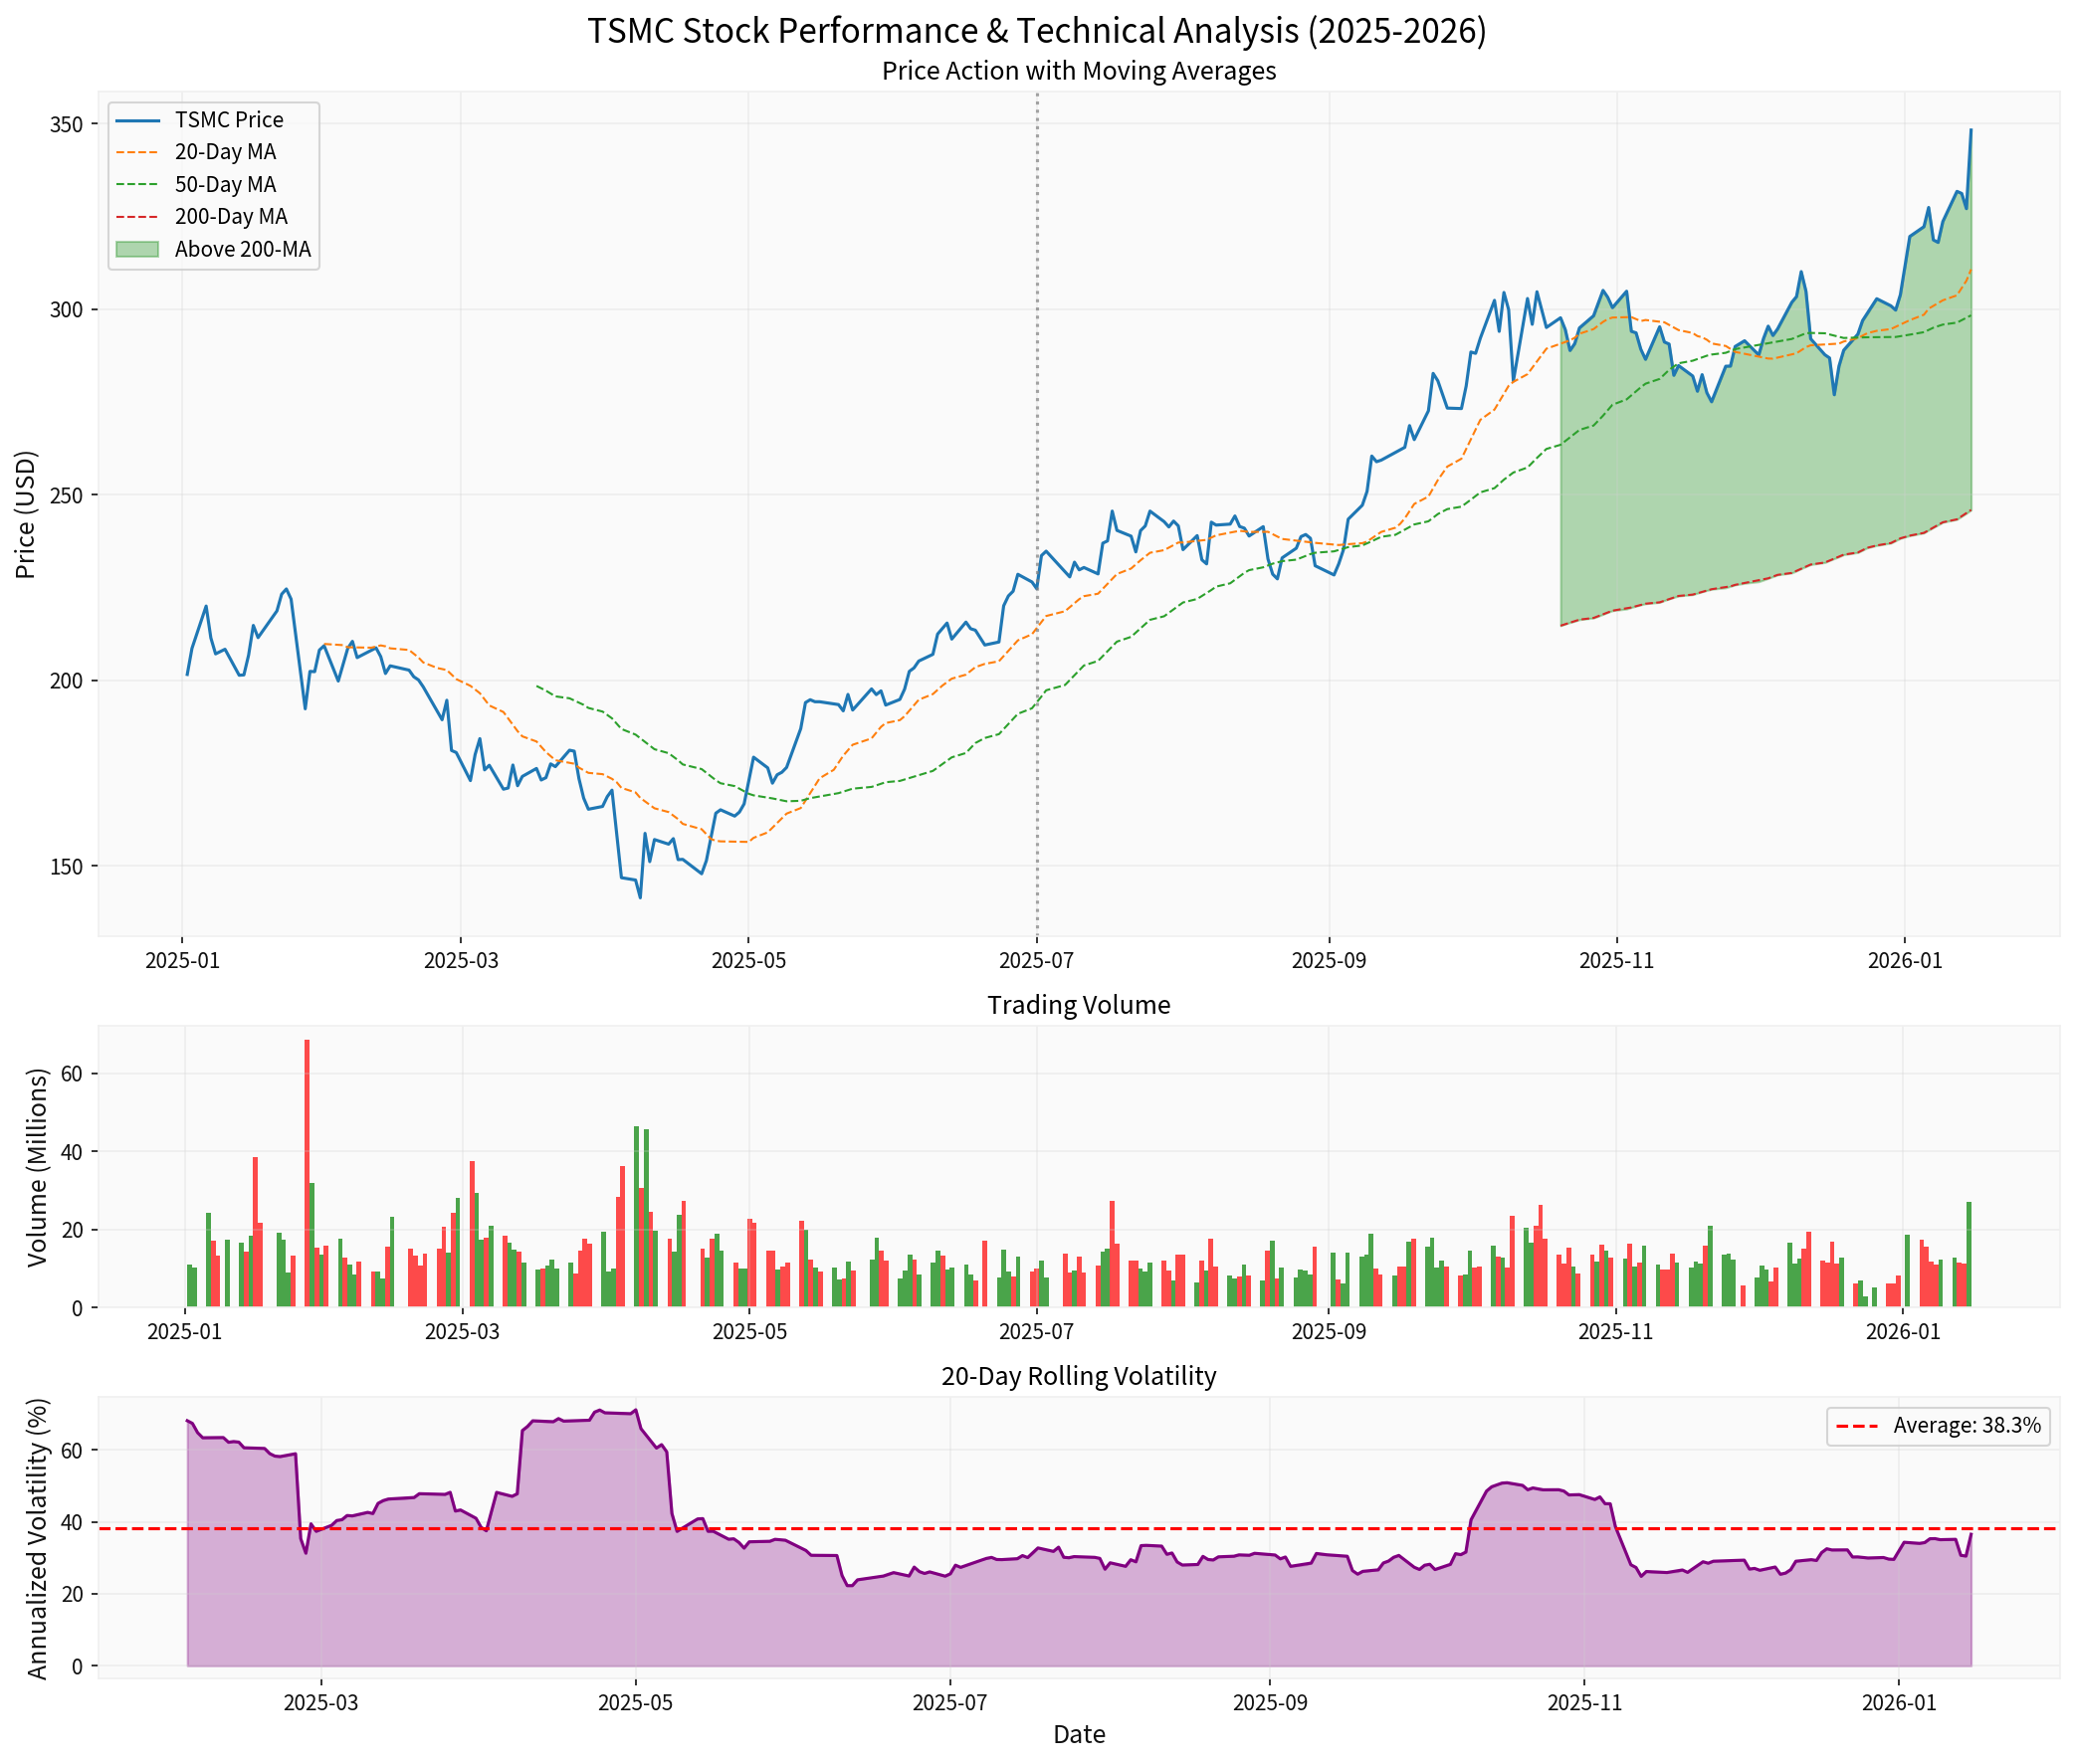
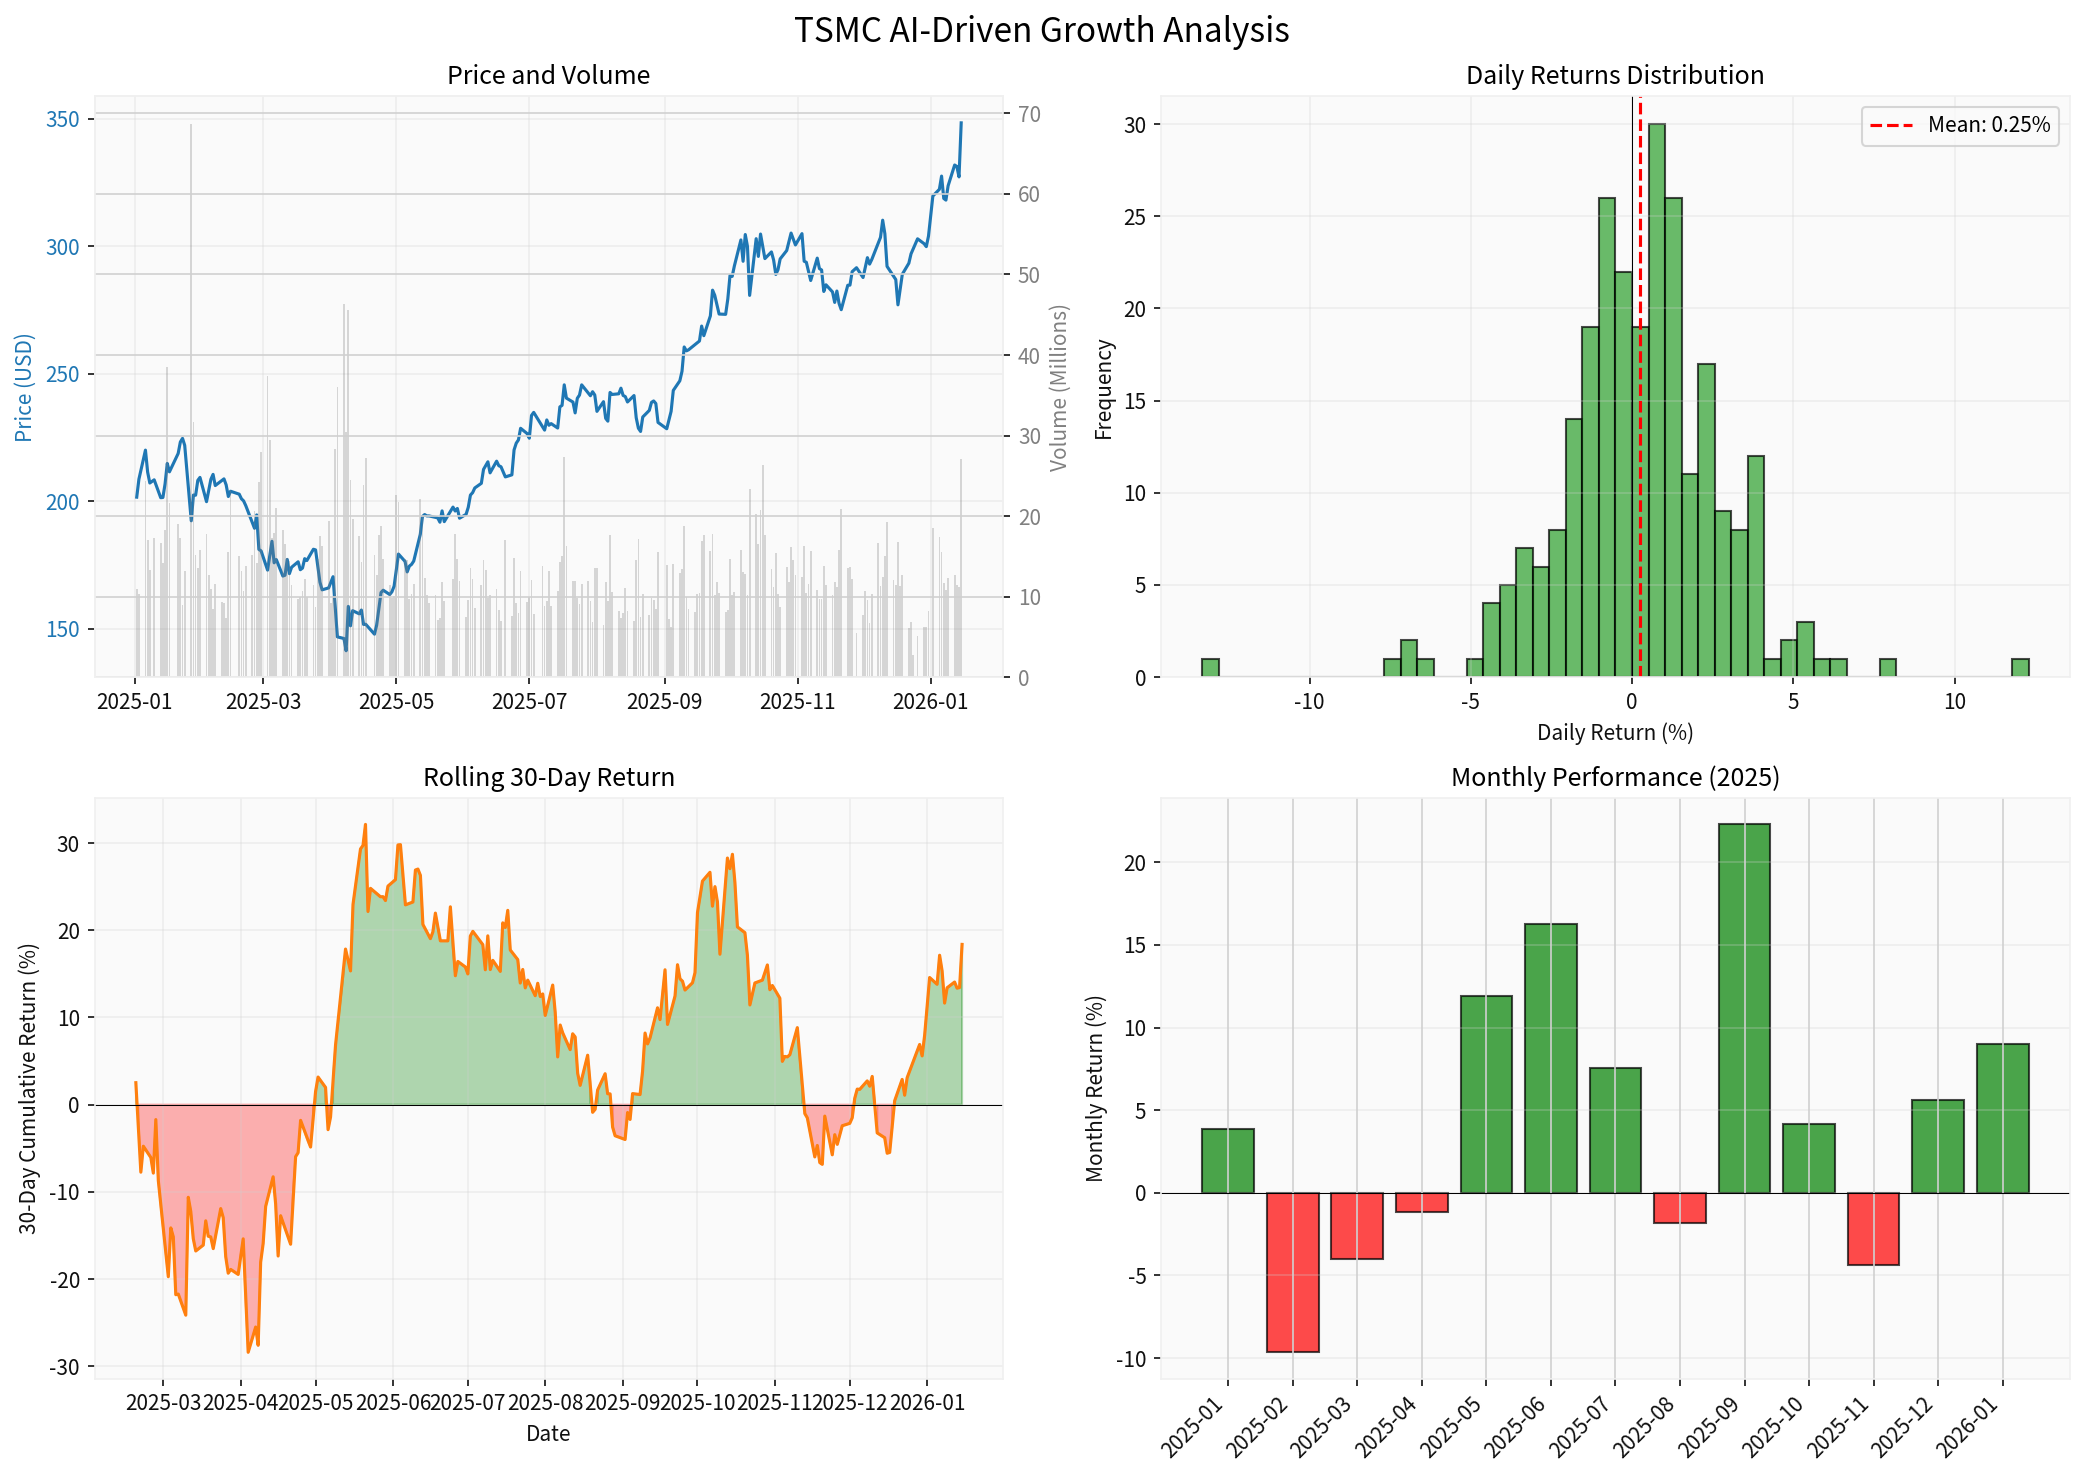
Taiwan Semiconductor Manufacturing Company (TSMC) has emerged as the pivotal beneficiary of the artificial intelligence revolution, with its stock delivering a remarkable
TSMC has demonstrated exceptional performance metrics across multiple timeframes:
| Timeframe | Performance | Market Context |
|---|---|---|
| 1 Day | +6.80% | Earnings-driven rally |
| 1 Month | +21.41% | Strong AI momentum |
| 3 Months | +14.65% | Sustained uptrend |
| 6 Months | +47.43% | AI boom acceleration |
| 1 Year | +68.93% | Outperforming broader market |
| YTD | +9.30% | Continued strength |
The stock is currently trading at
TSMC’s financial profile reflects its dominant market position and operational excellence:
- P/E Ratio: 27.62x (relative to sector average)
- P/B Ratio: 8.77x
- Net Profit Margin: 43.70%
- Operating Margin: 49.51%
- ROE: 34.52%
- Current Ratio: 2.69 (strong liquidity)
The company’s conservative accounting approach, combined with high depreciation-to-capex ratios, suggests potential earnings upside as investments mature [0]. With a
TSMC’s Q4 2025 results (reported January 15, 2026) exceeded expectations:
| Metric | Actual | Estimate | Surprise |
|---|---|---|---|
| EPS | $3.09 | $2.82 | +9.57% |
| Revenue | $33.11B | — | First $100B annual revenue |
The company achieved its
TSMC has announced a
- Revenue Growth Guidance: ~30% for 2026 (exceeding analyst consensus)
- AI as Primary Growth Driver: Data center AI chip demand remains the dominant catalyst
- Global Capacity Expansion: Accelerating fab construction in the US, Japan, and Germany
CEO C.C. Wei acknowledged investor concerns about capacity overbuild risks: “We’re investing $52 billion to $56 billion in capex. If we don’t do it carefully, that’d be a big disaster for TSMC” [1].
The AI semiconductor demand backdrop remains robust, supported by major customer commentary:
| Company | Executive | Key Comment |
|---|---|---|
| NVIDIA | Jensen Huang | “Demand for AI accelerators continues to run hot” |
| AMD | Lisa Su | “Need for AI computing power and users will surge” |
| Meta | — | Planning $60-65B AI infrastructure spending |
| Amazon | — | Sustained data center investment |
Multiple institutions have upgraded TSMC’s price targets in recent weeks:
| Firm | Price Target (NT$) | Previous | Action | Date |
|---|---|---|---|---|
| Goldman Sachs | 2,600-2,700 | — | Maintain Buy | Jan 2026 |
| JPMorgan | 2,100 | 1,700 | Maintain Overweight | Jan 2026 |
| JPMorgan (Taiwan) | NT$1,852 | — | Strong Buy consensus | Jan 2026 |
| Bernstein | NT$1,800 | — | Maintain Outperform | Dec 2025 |
The
| Rating | Count | Percentage |
|---|---|---|
| Buy/Strong Buy | 16 | 72.7% |
| Hold | 6 | 27.3% |
| Sell | 0 | 0% |
The
TSMC’s performance significantly outpaces broader semiconductor sector averages:
| Company | Market Cap | P/E (TTM) | 1Y Return | Analyst Target | Upside |
|---|---|---|---|---|---|
TSMC (TSM) |
$1.81T | 27.6x | +68.9% | $377.50 | +8.1% |
NVIDIA (NVDA) |
$4.59T | 46.2x | +38.4% | $265.00 | +40.6% |
Broadcom (AVGO) |
$1.64T | 71.1x | +52.5% | $450.00 | +29.4% |
AMD |
$385B | 116.3x | +97.7% | $290.00 | +22.3% |
S&P 500 (SPY) |
— | — | +24.8% | — | — |
TSMC has dramatically outperformed the S&P 500 on a relative basis:
- TSMC vs SPY YTD: TSMC has outperformed by approximately44 percentage points
- Key Outperformance Period: September 2025 (+22.3% monthly return coinciding with AI infrastructure spending announcements)
- Technical Position: Trading41.6% above 200-day moving average(strong bullish momentum)
| Metric | TSM | NVDA | AVGO | AMD |
|---|---|---|---|---|
| Sharpe Ratio (est.) | 1.49 | — | — | — |
| Max Drawdown (2025) | -37.1% | — | — | — |
| 20-Day Volatility | 36.5% | — | — | — |
| Beta vs SPY | Elevated | Very High | High | High |
TSMC offers a
TSMC’s AI-driven growth has contributed to sector-wide valuation multiple expansion:
- TSMC P/E Evolution: From ~20x (pre-AI boom) to 27.6x (current)
- Sector Implication: AI premium now priced into leading semiconductor names
- Relative Attractiveness: TSMC trades at a discount to NVIDIA (46.2x) and Broadcom (71.1x)
The semiconductor sector is experiencing a structural re-rating driven by:
- AI Revenue Visibility: TSMC’s 30% 2026 revenue growth guidance provides a floor for sector expectations
- Capital Spending Multiplier: TSMC’s $52-56B capex program signals confidence, benefiting equipment suppliers (ASML, Lam Research)
- Geographic Diversification: TSMC’s global fab expansion reduces concentration risk
- Pricing Power: Advanced node dominance (3nm, upcoming 2nm) supports margin expansion
| Metric | TSM | Semiconductor Avg. | Premium/Discount |
|---|---|---|---|
| P/E (TTM) | 27.6x | 35.2x | -22% (discount) |
| EV/FCF | 19.3x | 24.8x | -22% (discount) |
| ROE | 34.5% | 28.4% | +21% (premium) |
| Profit Margin | 43.7% | 32.1% | +36% (premium) |
TSMC trades at a
Based on the analysis, investors should consider the following allocation framework:
- TSMC as Foundation: 5-10% of semiconductor allocation as a core holding
- Rationale: Dominant market position (~60% foundry market share), AI exposure, and reasonable valuation
- NVIDIA (NVDA): Additional 3-5% for pure AI accelerator exposure
- Broadcom (AVGO): 2-4% for custom chip and networking exposure
- AMD: 1-2% for competitive AI CPU/GPU alternatives
- ASML: +1-2% for lithography equipment exposure
- Lam Research: +1-2% for wafer processing equipment
- Taiwan Semi (TSM): Already captured in core allocation
| Risk Factor | Mitigation Strategy |
|---|---|
| Geopolitical/Taiwan Risk | Geographic diversification (consider US-domiciled alternatives) |
| AI Demand Correction | Focus on companies with diversified revenue bases |
| Valuation Risk | TSMC’s relative discount provides margin of safety |
| Execution Risk | Capex overrun concerns (monitor quarterly guidance) |
| Currency Risk | ADR structure provides some hedging |
| Profile | TSMC Weight | Semiconductors Total | Key Rationale |
|---|---|---|---|
| Growth-Oriented | 8-12% | 15-20% | Maximize AI exposure |
| Balanced | 5-8% | 10-15% | Core holding with sector tilt |
| Defensive | 3-5% | 7-10% | Quality focus with limited AI beta |
| Risk-Averse | 0-3% | 5-8% | Limit concentration risk |
- Pullbacks toward 50-day moving average (~$298)
- Relative strength weakness vs. NVIDIA indicating sector rotation
- Post-earnings volatility compression
- P/E expansion above 35x (full valuation)
- AI demand commentary deterioration from major customers
- Breach of 200-day moving average on sustained basis
The semiconductor sector outlook remains constructive based on:
- TSMC’s 30% Revenue Growth Guidance: Sets the floor for sector expectations
- $1 Trillion+ AI Infrastructure Pipeline: Sustained capital spending visibility
- Productivity Gains from AI: Improving corporate earnings across technology sector
- Geographic Diversification: Reduced concentration risk through global fab expansion
| Risk | Probability | Impact | Mitigation |
|---|---|---|---|
| AI Demand Slowdown | Medium | High | Diversified customer base |
| Geopolitical Escalation | Medium | Very High | Geographic diversification |
| Capex Overbuild | Medium | High | Monitor utilization rates |
| Valuation Compression | Low-Medium | Medium | Strong fundamentals support multiples |
The semiconductor sector is undergoing
- AI as Primary Growth Driver: AI chips now represent the majority of leading foundry revenue
- Geographic Rebalancing: US, Japan, and Europe manufacturing capacity expansion
- Advanced Node Leadership: TSMC’s 2nm development maintains technology moat
- Vertical Integration Trends: Major customers developing custom silicon
- TSMC’s AI-driven growth trajectory remains robustwith 30% 2026 revenue growth guidance and $52-56B capex program
- Analyst price target upgrades are warrantedgiven the sustained AI demand and TSMC’s dominant positioning
- Sector valuations reflect AI premium, but TSMC trades at a discount to peers on earnings multiples
- Risk management is essentialgiven geopolitical concentration and execution risks on capex
- Allocation strategies should reflect investor profile, with core holdings ranging from 3-12% of semiconductor allocation
| Recommendation | Confidence | Timeframe |
|---|---|---|
| Maintain TSMC as core semiconductor holding | High | Medium-term |
| Expect continued multiple expansion | Medium | 6-12 months |
| Monitor AI demand commentary closely | High | Ongoing |
| Consider geographic diversification | Medium | Risk mitigation |
| Selective addition of supply chain beneficiaries | Medium | Tactical |
[0] 金灵AI API数据 (TSMC Company Overview, Financial Analysis, Market Data)
[1] Bloomberg - “TSMC’s Strong Outlook Fires Up Hopes of Sustained AI Boom” (https://www.bloomberg.com/news/articles/2026-01-15/tsmc-profit-beats-estimates-in-fresh-sign-of-ai-demand-strength)
[2] Yahoo Finance - “TSMC’s Strong Outlook Fires Up Hopes of Sustained AI Boom” (https://finance.yahoo.com/news/tsmc-strong-outlook-shores-hopes-072434087.html)
[3] Investing.com - Analyst Price Targets for Taiwan Semiconductor (https://www.investing.com/equities/taiwan-semicon)
[4] The New Indian Express - “Taiwan’s chipmaking giant TSMC logs net profit jump on AI boom” (https://www.newindianexpress.com/business/2026/Jan/15/taiwans-chipmaking-giant-tsmc-logs-net-profit-jump-on-ai-boom)
Insights are generated using AI models and historical data for informational purposes only. They do not constitute investment advice or recommendations. Past performance is not indicative of future results.
About us: Ginlix AI is the AI Investment Copilot powered by real data, bridging advanced AI with professional financial databases to provide verifiable, truth-based answers. Please use the chat box below to ask any financial question.