Nexa Resources (NEXA): 52-Week High Analysis and Investment Outlook
Unlock More Features
Login to access AI-powered analysis, deep research reports and more advanced features

About us: Ginlix AI is the AI Investment Copilot powered by real data, bridging advanced AI with professional financial databases to provide verifiable, truth-based answers. Please use the chat box below to ask any financial question.
Related Stocks
Based on comprehensive analysis of Nexa Resources’ stock performance, zinc market dynamics, and company fundamentals, here is a detailed assessment:
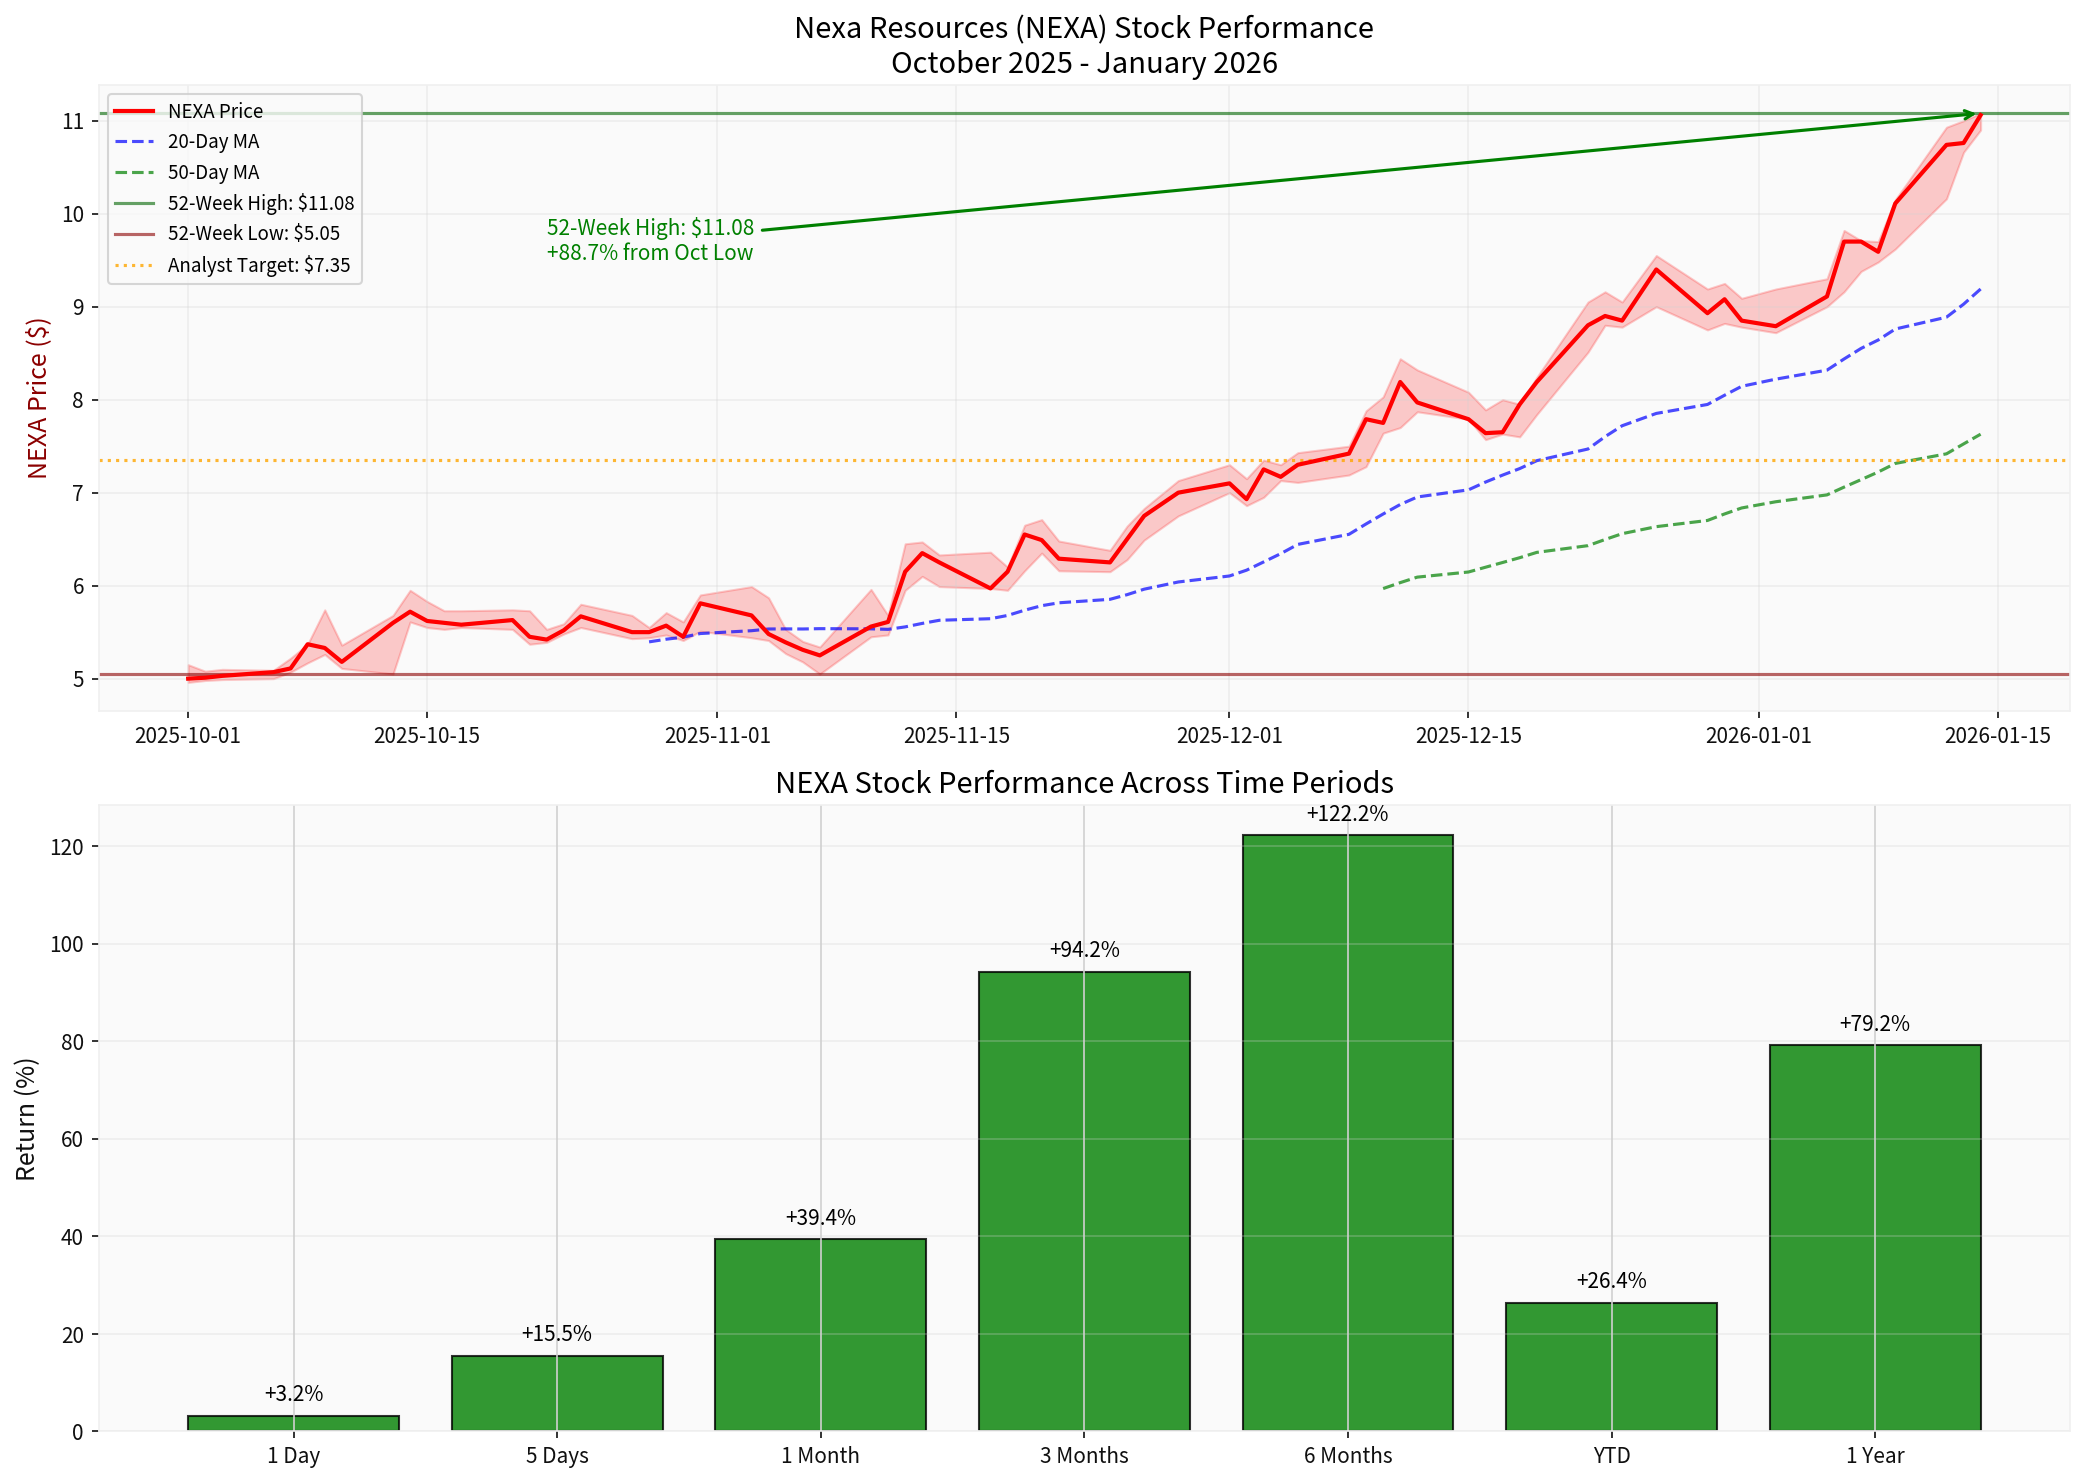
Nexa Resources has achieved a remarkable rally, reaching a 52-week high of $11.08, representing an extraordinary gain from its 52-week low of $5.05 [0]. The stock is currently trading at $11.06, essentially at its peak level (99.8% of 52-week high). Key performance metrics demonstrate exceptional momentum across all timeframes:
| Period | Return |
|---|---|
| 1 Day | +3.25% |
| 5 Days | +15.49% |
| 1 Month | +39.40% |
| 3 Months | +94.23% |
| 6 Months | +122.20% |
| 1 Year | +79.19% |
The company’s Q3 2025 results exceeded market expectations significantly:
- Net revenues: $764 million, up 8% year-over-year [1]
- EPS: $0.52 versus analyst forecast of $0.286 (+81.8% surprise) [1]
- Adjusted EBITDA: $186 million, up 16% from previous quarter [1]
- Net income: $100 million, demonstrating meaningful profitability improvement [1]
The EPS recovery from -$0.03 in Q3 to positive $0.52 represents a dramatic operational turnaround.
Zinc production reached
- Free cash flow generation of $52 million [1]
- Target to reduce net leverage to approximately 1x in coming years [1]
- Strong operational cash flow supporting capital allocation priorities
Scotiabank upgraded Nexa from “Sector Underperform” to “Sector Perform” on October 14, 2025, reflecting improved operational outlook [0]. However, the consensus rating remains “Hold” with a price target of $7.35—approximately
The stock exhibits lower volatility than the broader market, providing defensive characteristics within the materials sector [0]. This lower beta can attract risk-conscious investors during uncertain market conditions.
Zinc prices have demonstrated resilience, trading around
| Factor | Outlook |
|---|---|
| Morgan Stanley 2026 Forecast | $2,900/MT average [3] |
| Trading Economics Q1 2026 | $3,175/MT (end of quarter) [2] |
| 12-Month Forecast | $3,320/MT [2] |
| Global Supply-Demand | Surplus of 271,000 MT expected in 2026 [3] |
Key dynamics shaping zinc prices:
-
Near-Term Support: Upward momentum from 2025 LME average of $3,218 expected to continue through H1 2026 [3]
-
Chinese Demand Concerns: Chinese real estate sector weakness persists, limiting galvanizing steel demand (zinc’s primary end-use) [3]
-
Regional Disparities: Chinese production at surplus while rest of world faces supply shortages [3]
-
Policy Tailwinds: Trump administration policy proposals (December 17) could boost US housing sector and downstream zinc demand [3]
-
European Recovery: European zinc demand expected to grow following predicted 0.7% expansion in 2025 [3]
- Nexa’s integrated mine-smelter model provides margin protection during price volatility
- Production growth (+14% QoQ) amplifies revenue during favorable pricing environments
- Low-carbon operations differentiate Nexa from competitors in ESG-focused investment strategies [1]
- Latin American asset base provides geographic diversification away from Chinese demand concentration
- Long-term zinc surplus (271,000 MT in 2026) could pressure prices [3]
- Morgan Stanley’s 2026 forecast of $2,900/MT suggests potential price decline from current levels
- Chinese property sector weakness may persist through 2027 [3]
- US tariff implementation could impact advanced economy demand [3]
| Indicator | Value | Signal |
|---|---|---|
| MACD | No cross | Bullish |
| KDJ | K:91.5, D:86.0, J:102.6 | Overbought warning |
| RSI (14) | Overbought risk | Cautionary |
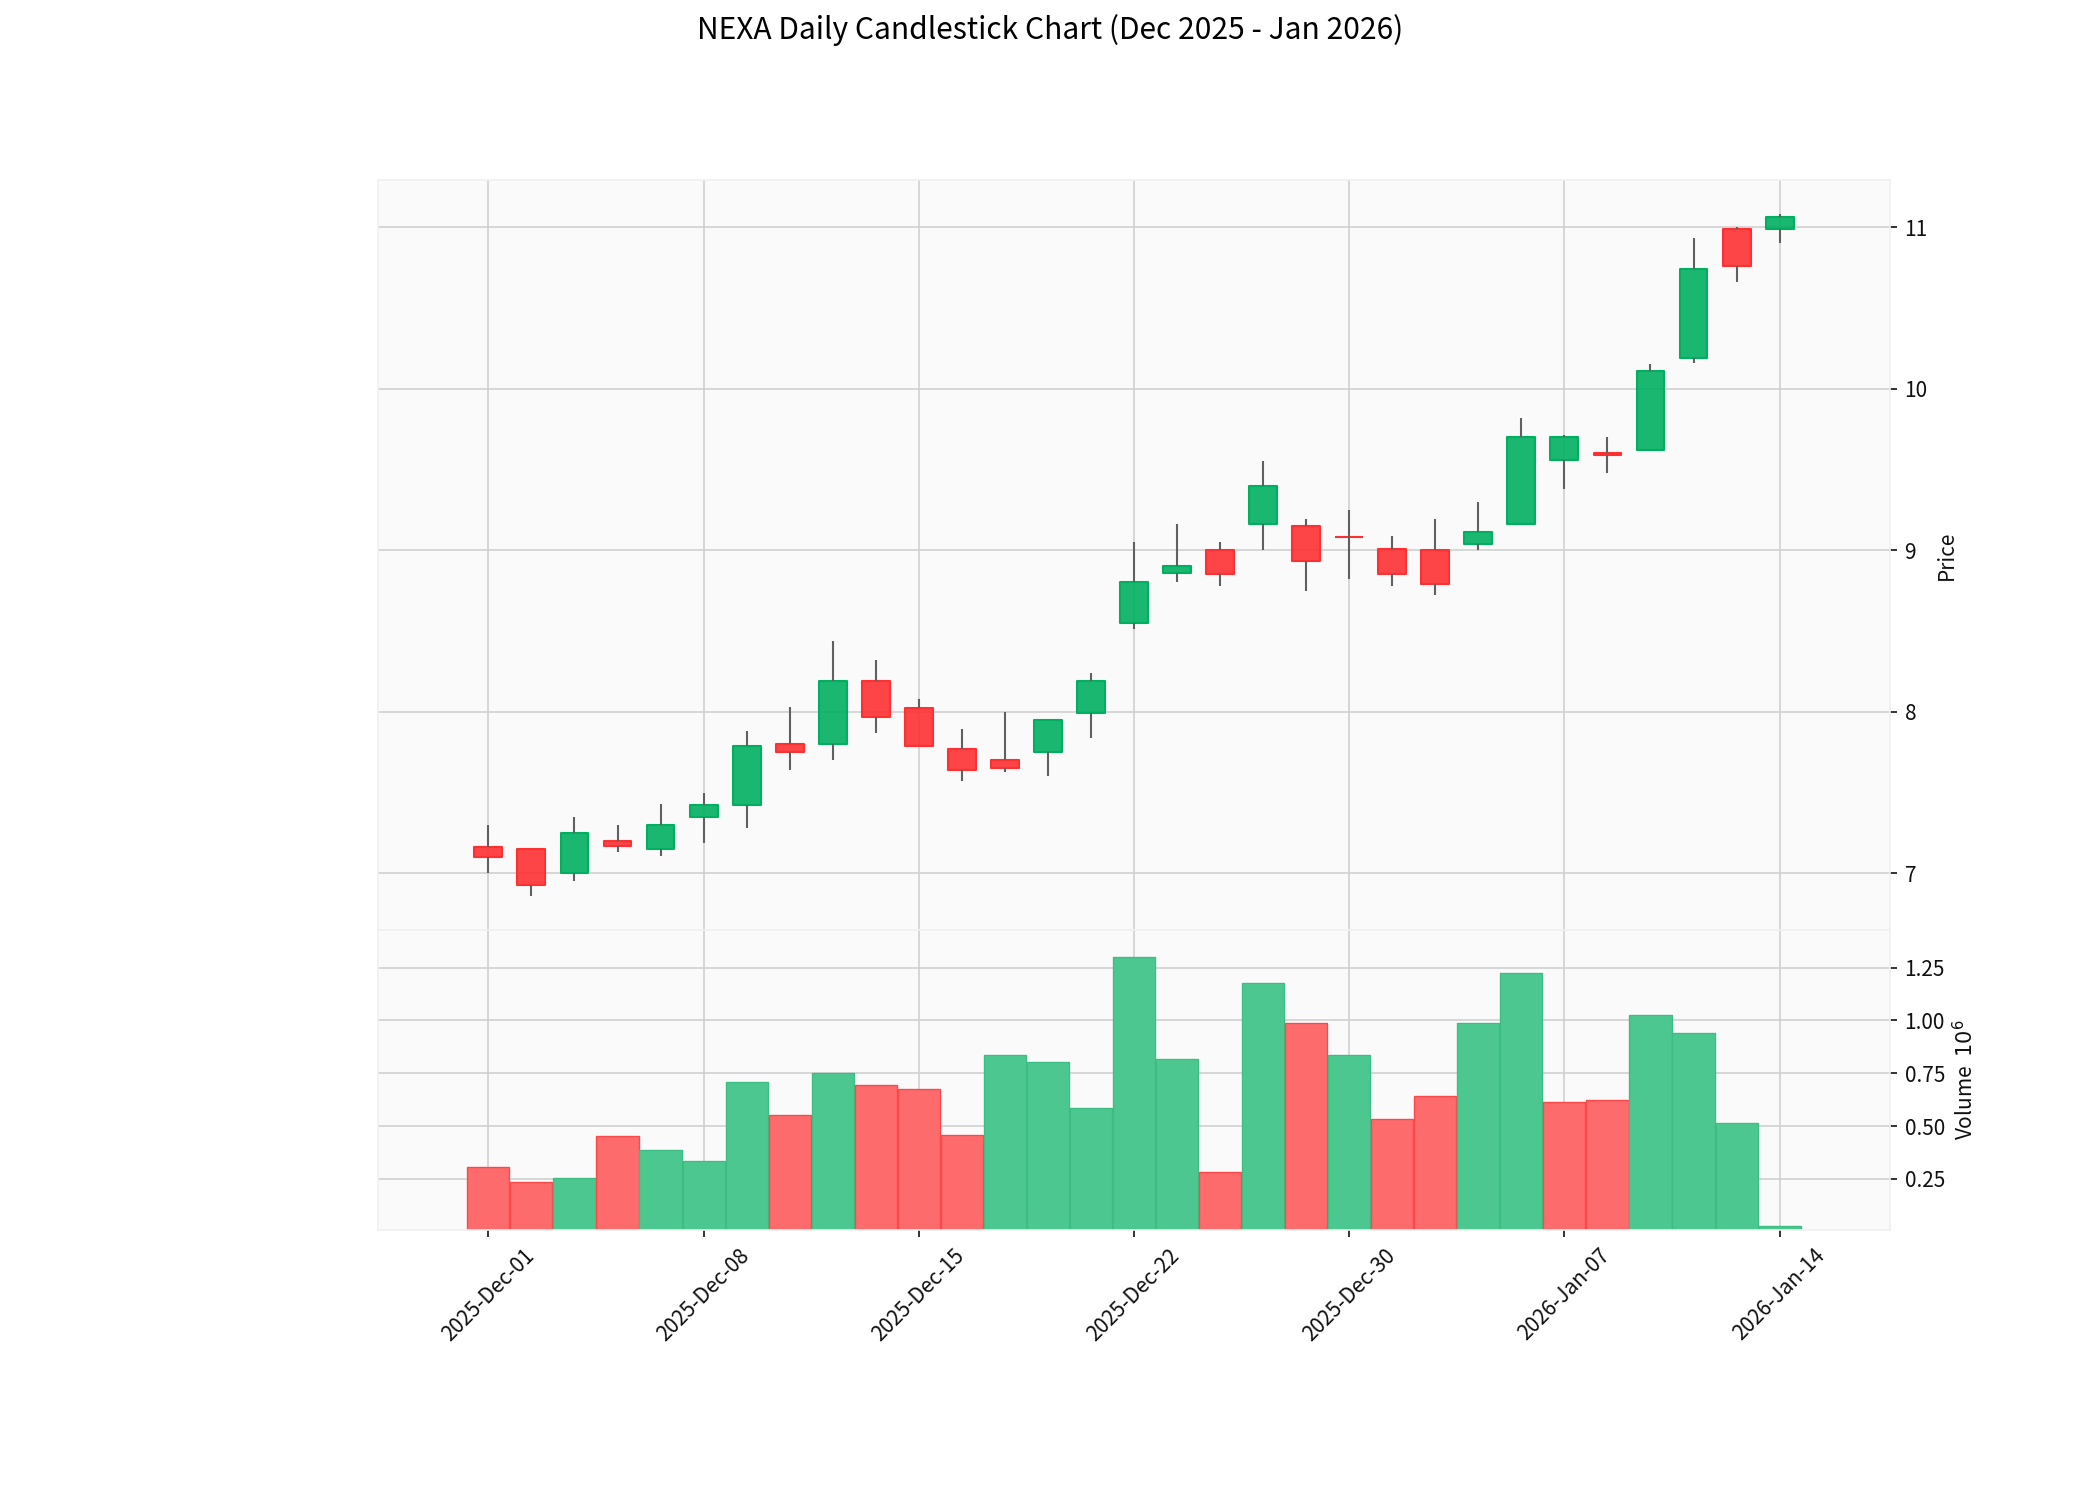
| 20-Day MA | $9.19 | Above 50-day MA ($7.63) |
| Beta | 0.54 | Defensive |
- Support: $9.84
- Resistance: $11.08 (52-week high)
- Next Target: $11.53
The KDJ indicator showing overbought conditions (J:102.6) and RSI risk suggest potential short-term consolidation or pullback despite the strong momentum [0].
Despite the strong price performance, significant valuation gaps exist:
- Current Price: $11.06
- Analyst Consensus Target: $7.35 (70% Hold, 30% Sell ratings) [0]
- Discount to Target: -33.8%
- P/E Ratio: -16.22x (negative due to prior losses) [0]
- P/S Ratio: 0.53x (potentially attractive if profitability sustains)
- Sustained zinc prices above $3,000/MT supporting revenue growth
- Continued production increases from Peruvian operations
- Potential further analyst upgrades
- Successful deleveraging improves financial flexibility
- US infrastructure spending boosting base metals demand
- Zinc price decline toward $2,900/MT forecast
- Overbought technical conditions triggering correction
- Chinese property sector weakness limiting demand
- Global surplus building in 2026-2027
- Earnings disappointment in upcoming Q4 report (February 19, 2026)
| Factor | Assessment |
|---|---|
Momentum |
Extremely Strong (+122% over 6 months) |
Valuation |
Overvalued relative to analyst targets |
Zinc Outlook |
Near-term constructive, long-term challenged |
Technical |
Overbought with potential consolidation |
Analyst Sentiment |
Cautious (Hold consensus) |
- February 19, 2026: Q4 FY2025 earnings report (EPS estimate: $0.35) [0]
- Zinc price movementsabove $3,200/MT or below $2,800/MT
- Production guidance updatesfor 2026
- Debt reduction progresstoward 1x net leverage target
- US policy developmentsaffecting infrastructure and housing sectors
[0] GoldLink API - Market Data and Technical Analysis
[1] Investing.com - “Earnings call transcript: Nexa Resources Q3 2025 beats revenue expectations” (https://www.investing.com/news/transcripts/earnings-call-transcript-nexa-resources-q3-2025-beats-revenue-expectations-93CH-4324390)
[2] Trading Economics - “Zinc Price - Chart - Historical Data” (https://tradingeconomics.com/commodity/zinc)
[3] Nasdaq - “Zinc Price Forecast: Top Trends for Zinc in 2026” (https://www.nasdaq.com/articles/zinc-price-forecast-top-trends-zinc-2026)
Insights are generated using AI models and historical data for informational purposes only. They do not constitute investment advice or recommendations. Past performance is not indicative of future results.
About us: Ginlix AI is the AI Investment Copilot powered by real data, bridging advanced AI with professional financial databases to provide verifiable, truth-based answers. Please use the chat box below to ask any financial question.