In-Depth Analysis of the Impact of China's Rare Earth Export Control Policies and Investment Value
Unlock More Features
Login to access AI-powered analysis, deep research reports and more advanced features
About us: Ginlix AI is the AI Investment Copilot powered by real data, bridging advanced AI with professional financial databases to provide verifiable, truth-based answers. Please use the chat box below to ask any financial question.
Related Stocks
Based on the latest data and policy developments, I will prepare a comprehensive and systematic analysis report on the rare earth industry.
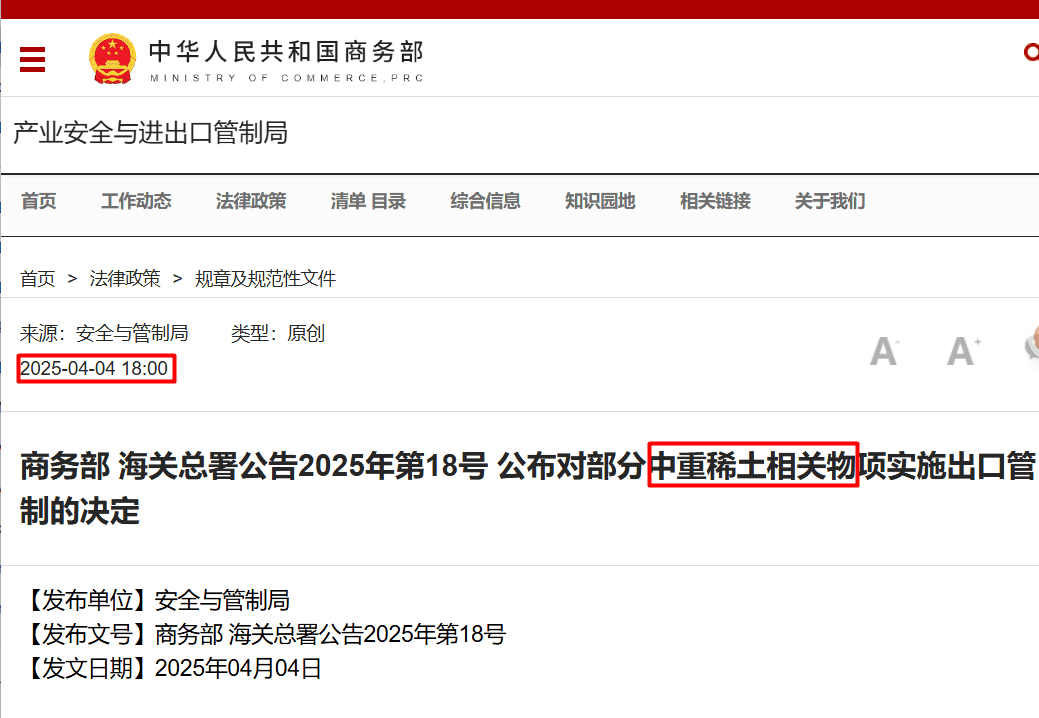
China’s rare earth export control policies continued to tighten in 2025, forming a systematic control framework from point to area[1][2]:
| Time Node | Control Measures | Covered Varieties |
|---|---|---|
| April 2025 | First implementation of export controls | 7 types of medium and heavy rare earths including samarium, gadolinium, terbium, dysprosium, lutetium, scandium, yttrium |
| October 2025 | Expanded control scope | Added 12 types of rare earths and semiconductor/AI-related materials |
| December 2025 | Dual-use items targeting Japan | Complete ban on exports of dual-use items to Japanese military enterprises |
China’s Ministry of Commerce has clearly stated that exports of rare earths for civil use will not be affected, and relevant parties engaged in normal civilian trade need not worry[1]. This statement reflects the precision of policy control, which is to strengthen the management of strategic resources while safeguarding legitimate commercial uses.
According to Japanese media reports, China’s rare earth export controls have had significant impacts[1][2]:
- Extended approval cycle: The procurement cycle for rare earth magnets has been extended from the previous 1-2 months to 3-4 months
- Stricter inspections: Chinese authorities are strictly verifying the end-user identity and purpose of rare earth-related products
- Increased difficulty in license issuance: Release is only allowed in two scenarios - products processed in Japan and re-exported to the US, or used by specific Japanese enterprises
Japanese Chief Cabinet Secretary Minoru Kihara expressed concern about this, and Japan is evaluating whether the dual-use items banned by China for export include rare earths[2]. According to statistics from the Japan Agency for Natural Resources and Energy, China’s rare earths accounted for 71.9% of Japan’s total rare earth imports in 2024[2].
China occupies an unshakable absolute dominant position in the global rare earth supply chain, and this advantage is reflected in all links of the entire industry chain[3]:
- According to 2025 data from the U.S. Geological Survey (USGS), China’s rare earth reserves are 44 million tons, accounting for 36.7%-48.9% of the global total, ranking first in the world
- China is the only country in the world that can stably supply 17 rare earth elements
- Light rare earths (Baiyun Obo) account for 80% of the global total, and heavy rare earths (Southern Jiangxi) account for 70% of the global total
- Global rare earth mine output was approximately 390,000 tons in 2024, with China ranking first with 270,000 tons, accounting for 69% of global output
- China’s total rare earth mining volume is controlled at 265,000 tons in 2025, including 250,000 tons of light rare earths and 19,500 tons of heavy rare earths
- China holds over 90% of the world’s rare earth processing capacity, with smelting and separation capacity accounting for 92.3% of the global total in 2023, and still exceeding 90% in 2025
- The separation purity reaches 99.999%, and the cost is only 1/3-1/4 of that overseas
- Global rare earth permanent magnet output was 310,200 tons in 2025, with China’s output reaching 284,200 tons, accounting for 91.62% of the global total
- The proportion of high-end products exceeds 35%, realizing the transformation from a resource power to a magnet technology power
This entire industry chain advantage from resources to processing and then to applications means that almost all rare earths in the world need to be transported to China for refining and processing. MP Materials, the only rare earth mine in the U.S., still needs to transport its ore to China for processing[3].
Despite China’s stable dominant position, the global rare earth supply chain is undergoing in-depth restructuring[3]:
- As the only domestic rare earth producer in the U.S., MP Materials produced only 721 tons of neodymium-praseodymium oxide in 2025
- The U.S. Department of Defense has invested over $439 million to sign a long-term supply agreement with MP Materials
- It will take at least 3-5 years to form large-scale production capacity
- Lynas successfully produced dysprosium oxide and terbium oxide at its Malaysian plant in May 2025, with an annual production capacity of 1,500 tons
- Its Texas plant in the U.S. is expected to start production in 2026, with a target annual output of 2,500-3,000 tons of heavy rare earths
- The mining ban that took effect on December 31, 2025, led to a 40% reduction in medium and heavy rare earth supply
- The supply of terbium ore was completely cut off, further exacerbating global supply tensions
Based on the above analysis, the global rare earth supply chain will present a pattern of “China-led, multi-point supplementation” in the medium term. China’s market share may drop from the current over 90% to 75%-80%, but it will still maintain an absolute dominant position[3].
Starting from the third quarter of 2024, the price of rare earth concentrate has been raised 6 consecutive times, increasing from 16,741 yuan/ton to 26,834 yuan/ton in the first quarter of 2026, with a cumulative increase of over 60%[3][4]. Data from the Rare Earth Industry Association shows:
| Variety | 2025 Average Price | Year-on-Year Increase |
|---|---|---|
| Neodymium Oxide | 508,700 yuan/ton | +27.4% |
| Neodymium Metal | 625,800 yuan/ton | +27.0% |
| Terbium Oxide (99.99%) | 6,738,700 yuan/ton | +17.2% |
| Terbium Metal | 8,359,100 yuan/ton | +16.5% |
Notably, the price of the rare earth element yttrium in Europe has soared by nearly 1500% this year, with the price of yttrium oxide rising from less than $8 per kilogram at the end of 2024 to approximately $126 per kilogram[4].
Based on the supply and demand pattern and geopolitical factors, institutions have made the following forecasts for rare earth prices[3]:
| Rare Earth Variety | Current Price | 3-Month Target Price | Expected Increase | 6-Month Target Price | Expected Increase |
|---|---|---|---|---|---|
| Praseodymium-Neodymium Oxide | 640,000 yuan/ton | 750,000-800,000 yuan/ton | 17%-25% | 850,000-900,000 yuan/ton | 33%-41% |
| Dysprosium Oxide | 1,420,000 yuan/ton | 1,800,000-2,000,000 yuan/ton | 27%-41% | 2,200,000-2,500,000 yuan/ton | 55%-76% |
| Terbium Oxide | 6,240,000 yuan/ton | 8,000,000-9,000,000 yuan/ton | 28%-44% | 10,000,000-12,000,000 yuan/ton | 60%-92% |
| Neodymium Metal | 770,000 yuan/ton | 900,000-950,000 yuan/ton | 17%-23% | 1,000,000-1,100,000 yuan/ton | 29%-43% |
Historical experience shows that after China implemented export controls on 7 types of medium and heavy rare earths in April 2025, the price of dysprosium in Europe soared by 310% within 30 days[3]. The news of the G7 reducing rare earth imports from China will further exacerbate supply concerns and push prices to rise faster.
Against the backdrop of global supply chain restructuring and the rise in the central rare earth price level, the performance growth expectations of Chinese rare earth enterprises have significantly increased[3][5]:
- The world’s largest light rare earth enterprise, controlling the Baiyun Obo Mine, the world’s largest rare earth mine
- Its rare earth reserves account for over 80% of the national total, and 67.9% of the domestic light rare earth mining quota (189,000 tons)
- In the first half of 2025, its net profit attributable to shareholders was 931 million yuan, a year-on-year surge of 1,951.52%
- Performance growth path: 2.5-3 billion yuan in net profit in 2025 → 10 billion yuan in 2026 → 15 billion yuan in 2027 (three-year compound growth rate exceeding 200%)
- Leading enterprise in medium and heavy rare earths, controlling 40% of the reserves of southern ionic rare earth mines
- Its strategic elements such as dysprosium and terbium account for 80% of the global total, and it obtained 100% of the heavy rare earth mining quota (20,000 tons) in 2025
- Expected net profit of 1.5-2 billion yuan in 2025 → 3-4 billion yuan in 2026 → 5-6 billion yuan in 2027
The Rare Earth Index (884215) is expected to show a continuous upward trend from the current 12,673 points[3]:
- 3-month target: 14,500-15,500 points (15%-22% increase)
- 6-month target: 16,000-18,000 points (26%-42% increase)
There will be obvious structural differentiation within the sector:
| Echelon | Enterprise Type | Expected Increase | Representative Enterprises |
|---|---|---|---|
| First Echelon | Leading medium and heavy rare earth enterprises | 25%-35% | China Rare Earth, Xiamen Tungsten |
| Second Echelon | Leading light rare earth enterprises | 15%-20% | Northern Rare Earth |
| Third Echelon | Deep processing enterprises | 10%-15% | JL MAG Rare-Earth, etc. |
| Fourth Echelon | Smelting and separation enterprises | 5%-10% | China Minmetals Rare Earth, etc. |
The differentiation pattern mainly stems from: the scarcer supply of medium and heavy rare earths, larger price increases, and resource-based enterprises can directly benefit from price increases.
Although the investment value of the rare earth sector is prominent, the following risk factors still need to be noted[6]:
-
Far-reaching but controllable policy impact:The precise implementation of China’s rare earth export control policies has effectively strengthened the management of strategic resources while safeguarding normal civilian trade, enhancing its discourse power in global rare earth pricing.
-
China’s stable dominant position:Despite the restructuring pressure on the global supply chain, China will still maintain an absolute dominant position in the short to medium term due to technical barriers and cost advantages in core links such as smelting and separation.
-
Continuous rise in the central price level:Strengthened supply-side constraints (quota management + Myanmar mining ban) + demand-side growth (new energy, wind power, robots) → rare earth prices are expected to continue to rise.
-
Significant investment value:Rare earth mining companies directly benefit from price increases, leading enterprises have seen explosive performance growth, and the medium- to long-term development trend of the sector is clear.
[1] Guancha.cn - Japanese media hypes that China’s countermeasures involve civilian use, and Japan has new developments (https://www.guancha.cn/internation/2026_01_09_803349.shtml)
[2] Securities Times - How big is the impact of China’s export control on dual-use items to Japan (https://www.stcn.com/article/detail/3582827.html)
[3] Eastmoney.com - The impact of G7 reducing rare earth imports from China on rare earth stocks is far-reaching (https://caifuhao.eastmoney.com/news/20260113183044719959650)
[4] CTIA.com.cn - Rare Earth News (https://www.ctia.com.cn/news/rare-earth-news)
[5] Investing.com - Northern Rare Earth (600111) Stock Analysis (https://cn.investing.com/equities/rare-earth)
[6] Research Nester - Rare Earth Metals Market Size and Share, 2035 Growth Forecast (https://www.researchnester.com/cn/reports/rare-earth-metals-market/5142)
Insights are generated using AI models and historical data for informational purposes only. They do not constitute investment advice or recommendations. Past performance is not indicative of future results.
About us: Ginlix AI is the AI Investment Copilot powered by real data, bridging advanced AI with professional financial databases to provide verifiable, truth-based answers. Please use the chat box below to ask any financial question.