Analysis of the Impact of Slowing U.S. Private Sector Job Growth on Fed Monetary Policy and U.S. Stock Valuations
Unlock More Features
Login to access AI-powered analysis, deep research reports and more advanced features
About us: Ginlix AI is the AI Investment Copilot powered by real data, bridging advanced AI with professional financial databases to provide verifiable, truth-based answers. Please use the chat box below to ask any financial question.
Related Stocks
Based on the latest economic data and my analytical framework, I will provide you with a systematic and comprehensive analysis report.
The U.S. labor market showed a significant slowdown trend in 2025. According to data from the U.S. Bureau of Labor Statistics (BLS), nonfarm payrolls increased by only
Annual job growth showed a clear pattern of ‘strong in the first half, weak in the second half’:
- Average monthly increase of 82,833 jobs in the first half of the year
- Average monthly increase of only 14,500 jobs in the second half of the year
- 2025 was the weakest year for job growth (in a non-recession year) since 2003[5]
On the unemployment front, the December unemployment rate edged down from 4.5% in November to 4.4%, temporarily breaking the upward trend that began in July 2025[3].
The Federal Reserve implemented
Current market expectations for a rate cut at the January 2026 FOMC meeting are extremely low:
- The CME FedWatch Tool shows the probability of a rate cut in January is only 5%-16%[7][8]
- The market expects an additional 50 basis pointsof rate cuts in 2026 (i.e., 1-2 25bp cuts)[6][9]
- Bond market pricing shows the probability of a rate cut in April rises to 45%, with the next possible rate cut in September[6]
As a core indicator of the Fed’s dual mandate (inflation and employment), employment data has a direct impact on monetary policy orientation. The impact of the current employment slowdown on Fed policy expectations shows the following characteristics:
- Strengthened dovish tilt: Sustained weak job growth has reinforced market expectations that the Fed will maintain an accommodative stance
- Slower pace of rate cuts: Despite the employment slowdown, sticky inflation (partly affected by tariffs) limits a more aggressive easing path[6]
- Rising uncertainty in forward guidance: Increased volatility in labor market data (negative readings in the summer) makes the policy path more difficult to predict[6]
- Vice Chair Steven Miran supported a 50bp rate cutat the December meeting, indicating divisions within the FOMC[7]
- Kansas City Fed President Jeffrey Schmid and Chicago Fed President Austan Goolsbee opposed rate cuts[7]
- Chairman Powell hinted that future rate cuts will be ‘more cautious’[6]
Based on current data, the market consensus expectations are as follows:
| Time Node | Policy Rate Expectation | Rate Cut Probability |
|---|---|---|
| January 2026 FOMC | Maintain 3.50%-3.75% | 5%-16% |
| April 2026 | Likely cut to 3.25%-3.50% | ~45% |
| End of 2026 | Range of 3.00%-3.50% | Expected additional 25-50bp cut |
- Inflation falls short of expectations (core PCE is expected to drop to 2.5% in 2026, but may remain sticky in early 2026 due to tariff pass-through)[6]
- Risk of economic ‘hard landing’: If the unemployment rate rises further, it could trigger more aggressive rate cuts (UBS expects 200-300bp of rate cuts in 2026 in a pessimistic scenario)[9]
As of January 12, 2026, the main valuation indicators for U.S. stocks are as follows:
- S&P 500 Index: 6,977 points (all-time high)[0]
- SPY (S&P 500 ETF): $695.16, P/E ratio of 28.15x[0]
- S&P 500 Forward P/E Ratio:22.41x, representing an approximately15.5% premiumover the historical average of 19.4x[10]
- Nasdaq Composite Index: 23,734 points[0]
Goldman Sachs Research expects the S&P 500 to deliver a
- Improved liquidity environment: The Fed’s rate cut cycle reduces the discount rate, supporting valuations of risky assets
- Soft landing expectations: The employment slowdown has not evolved into an economic recession, and the market is pricing in a ‘soft landing’ scenario
- AI investment boom: Strong earnings growth in the technology sector partially offsets concerns about economic slowdown[11]
- Earnings growth risks: If the employment slowdown spills over into consumption and corporate capital expenditure, earnings growth may fall short of expectations
- Valuations at historical highs: The 22.41x forward P/E is significantly above the historical average, and any earnings miss could lead to more severe valuation compression
- Market concentration risk: The top few tech stocks have contributed 53% of the S&P 500’s returns over the past two years[11], with concentration reaching an all-time high
Comparing the current environment with historical periods:
| Period | Forward P/E | Background | Subsequent Performance |
|---|---|---|---|
| Current (Jan 2026) | 22.4x | Slowing employment + Fed rate cuts | To be observed |
| Late 1999 | ~25x | Pre-dot-com bubble | Sharp decline in the following two years |
| Early 2007 | ~16x | Pre-subprime crisis | Plummeted in the following year |
-
The employment slowdown has established the Fed’s accommodative stance, but the pace of rate cuts will be more gradual. The cooling labor market was the main driver of the three rate cuts in 2025, but sticky inflation means rate cuts in 2026 will be more cautious.
-
U.S. stock valuations are at relatively high levels, with earnings growth being the main driver of the 2026 market. The current 22.4x forward P/E incorporates optimistic expectations of a ‘soft landing’ and continued Fed easing, and any expectation gap could lead to valuation adjustments.
-
Market volatility may rise. Increased volatility in employment data (negative readings in the summer), growing policy divisions, and elevated valuations all suggest that short-term market volatility may intensify.
| Scenario | Trigger | Market Impact |
|---|---|---|
Base Case |
Economic soft landing, employment cools slowly | Moderate gains, structural opportunities |
Bull Case |
Employment rebounds more than expected, inflation falls rapidly | More aggressive rate cuts, tech stocks lead gains |
Bear Case |
Employment deteriorates sharply, economic recession | Liquidity easing but earnings slump, valuation compression |
- Focus on quality factors: In an environment of rising earnings uncertainty, high-quality companies with stable cash flow and low leverage will be more defensive
- Balanced allocation: Avoid excessive concentration in high-valued tech stocks, focus on reasonably valued value sectors
- Focus on rate-sensitive sectors: After the Fed’s easing path is confirmed, rate-sensitive sectors such as finance and real estate may benefit
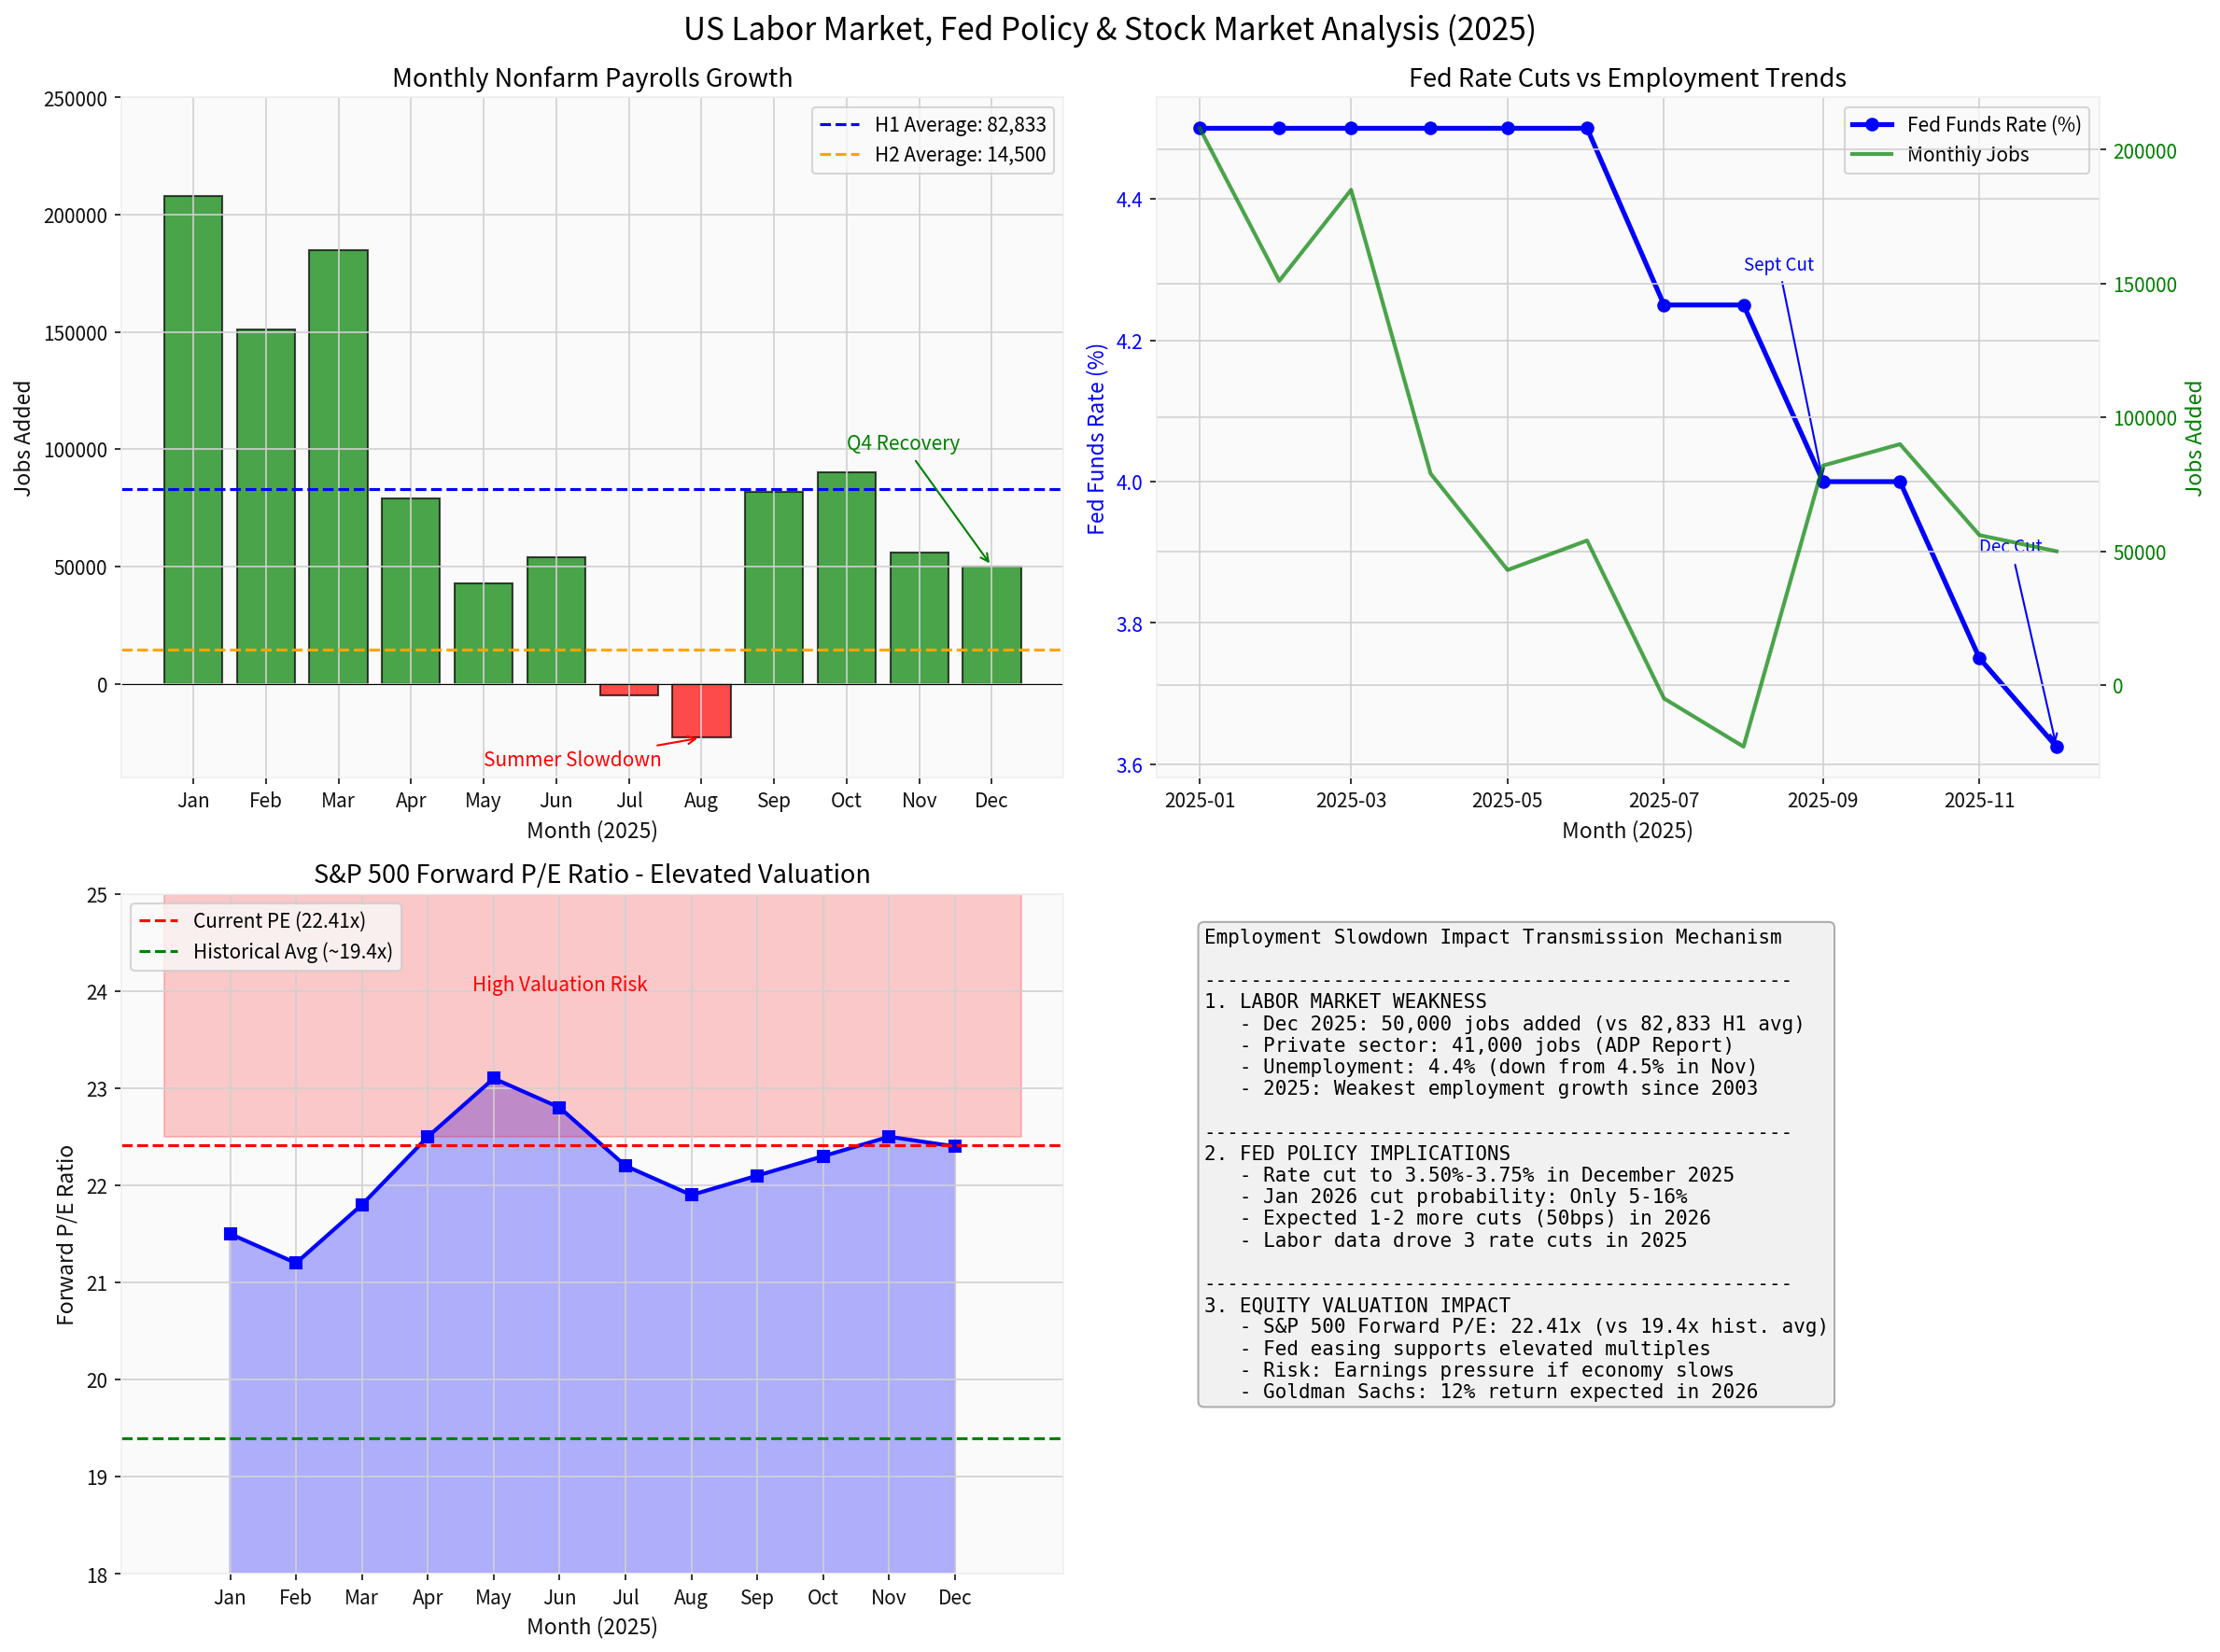
The chart above shows the linkage between the 2025 U.S. labor market, Fed policy path, and stock market valuations:
- Top left chart: Monthly nonfarm payroll growth showed a clear pattern of ‘strong in the first half, weak in the second half’
- Top right chart: Fed rate cuts and employment slowdown show an inverse correlation
- Bottom left chart: The S&P 500 forward P/E has remained about 15.5% above the historical average
- Bottom right chart: Transmission mechanism of the impact of employment slowdown on the market and policy
[1] Trading Economics - United States Non Farm Payrolls (https://tradingeconomics.com/united-states/non-farm-payrolls)
[2] RSM US LLP - The outlook for another Fed rate cut in January (https://rsmus.com/insights/economics/another-fed-rate-cut-january.html)
[3] St. Louis Fed - Flash Report: U.S. Jobless Rate Ticked Down in December (https://www.stlouisfed.org/on-the-economy/2026/jan/flash-report-us-unemployment-rate-declines-december)
[4] ADP - ADP National Employment Report: Private Sector Employment Increased by 41,000 Jobs in December (https://mediacenter.adp.com/2026-01-07-ADP-National-Employment-Report-Private-Sector-Employment-Increased-by-41000-Jobs-in-December-Annual-Pay-was-Up-4-4)
[5] American Progress - December Jobs Day Closes a Year of a Stalling Labor Market (https://www.americanprogress.org/article/december-jobs-day-closes-a-year-of-a-stalling-labor-market/)
[6] Morningstar - What’s Next for the US Fed in 2026? (https://global.morningstar.com/en-gb/markets/whats-next-us-fed-2026)
[7] CNN - The US economy added just 50000 jobs last month (https://www.cnn.com/business/live-news/us-jobs-report-december-01-09-2026)
[8] Investopedia - DOJ’s Powell Probe Has People Asking One Big Question (https://www.investopedia.com/doj-powell-probe-has-people-asking-one-big-question-what-happens-to-interest-rates-11883616)
[9] UBS - What do Fed rate cuts mean for investors? (https://www.ubs.com/us/en/wealth-management/insights/market-news/article.2979043.html)
[10] MacroMicro - US S&P 500 Forward PE Ratio (https://en.macromicro.me/series/20052/sp500-forward-pe-ratio)
[11] Goldman Sachs - The S&P 500 Is Expected to Rally 12% This Year (https://www.goldmansachs.com/insights/articles/the-sp-500-expected-to-rally-12-this-year)
Insights are generated using AI models and historical data for informational purposes only. They do not constitute investment advice or recommendations. Past performance is not indicative of future results.
About us: Ginlix AI is the AI Investment Copilot powered by real data, bridging advanced AI with professional financial databases to provide verifiable, truth-based answers. Please use the chat box below to ask any financial question.