Clearwater Analytics (CWAN): Insider Trading Signal and Investment Decision Analysis
Unlock More Features
Login to access AI-powered analysis, deep research reports and more advanced features

About us: Ginlix AI is the AI Investment Copilot powered by real data, bridging advanced AI with professional financial databases to provide verifiable, truth-based answers. Please use the chat box below to ask any financial question.
Related Stocks
Based on the acquired data and analysis, I now present to you a complete analysis report on investment implications.
According to the latest SEC filings, Clearwater Analytics announced on December 21, 2025, that it had reached a definitive acquisition agreement with an investor group led by Permira and Warburg Pincus, with a transaction valuation of approximately
The key timeline milestones for the transaction include:
- Agreement Signing Date: December 20, 2025
- Go-Shop Period: December 20, 2025, to January 23, 2026
- Expected Completion Date: First half of 2026
- Transaction Conditions: Subject to shareholder approval and regulatory clearance[1]
Notably, during the Go-Shop period, the company may still actively solicit and evaluate alternative acquisition proposals. If a superior offer is received, the current agreement may be terminated. This means that
Regarding the stock sale by CTO Das Souvik that you mentioned, according to Form 4 filings from authoritative sources such as Whalewisdom and NASDAQ[2][3]:
| Item | Details |
|---|---|
Transaction Date(s) |
December 31, 2025 (option exercise), January 1, 2026 (share sale) |
Transaction Type |
M (option exercise) + S (share sale) - Mandatory tax sale (Sell-to-Cover) |
Number of Shares Sold |
41,594 shares |
Transaction Price |
$24.0836 (weighted average) |
Total Transaction Value |
Approximately $1,001,000 |
Exercise Price |
$0 (restricted stock unit (RSU) vesting) |
Shares Held After Sale |
148,224 shares (approximately $3.575 million in market value) |
-
“Sell-to-Cover” Mechanism: When executives of U.S. listed companies exercise stock options or have RSUs vest, they typically need to sell some shares to cover related income tax obligations. This type of transaction issystematic and mandatory, rather than a sell-off driven by the executive’s active judgment of the company’s valuation[2].
-
Transaction Synchronization: CEO Sandeep Sahai conducted similar RSU vesting and share sale transactions during the same period (December 31, 2025), which also fell under sell-to-cover for tax purposes[4]. This indicates that this is a regular equity incentive vesting process at the company level.
-
Limited Sale Proportion: After selling 41,594 shares, Das Souvik still holds 148,224 shares, accounting for approximately 22% of his total holdings. Considering this is a mandatory sale to cover taxes,the executive still retains significant equity risk exposure.
| Signal Type | Typical Characteristics | Interpretation Direction |
|---|---|---|
Active Sell-Off (D-Sale) |
Executive voluntarily sells a large number of shares in the open market | Caution signal, may reflect concerns about valuation |
Sale After Option Exercise (Exercise+Sell) |
Immediate sale after exercising options at a low price | Need to determine if it is for tax arrangements |
Sell-to-Cover for Tax Purposes |
Exercise price is close to 0 or extremely low, sold at a prescribed ratio | Neutral signal, a regular operation |
Large-Scale Share Reduction (>50% of Holdings) |
Sells most or all holdings | Negative signal, need to investigate the cause in depth |
In this case, Das Souvik’s transaction falls under the
| Indicator | Value |
|---|---|
Current Stock Price |
$24.09 |
Acquisition Offer Price |
$24.55 |
Implied Premium |
1.91% |
52-Week Price Range |
$15.74 - $24.28 |
Stock Price Before Announcement (November 10) |
Approximately $16.70 |
Based on the data, the current stock price is very close to the acquisition offer price, with a premium margin of only about 1.91%. This indicates that
| Time Period | Average Daily Trading Volume |
|---|---|
Before Announcement (Mid-November to Mid-December 2025) |
Approximately 11 million shares |
After Announcement (December 21-31, 2025) |
Approximately 24.9 million shares |
Trading volume
There has been a recent trend of analysts downgrading their ratings:
| Date | Institution | Rating Change |
|---|---|---|
| January 8, 2026 | Wells Fargo | Overweight → Equal Weight |
| December 23, 2025 | Piper Sandler | Overweight → Neutral |
| December 22, 2025 | William Blair | Outperform → Market Perform |
| December 22, 2025 | Oppenheimer | Outperform → Perform |
These downgrades may reflect analysts’
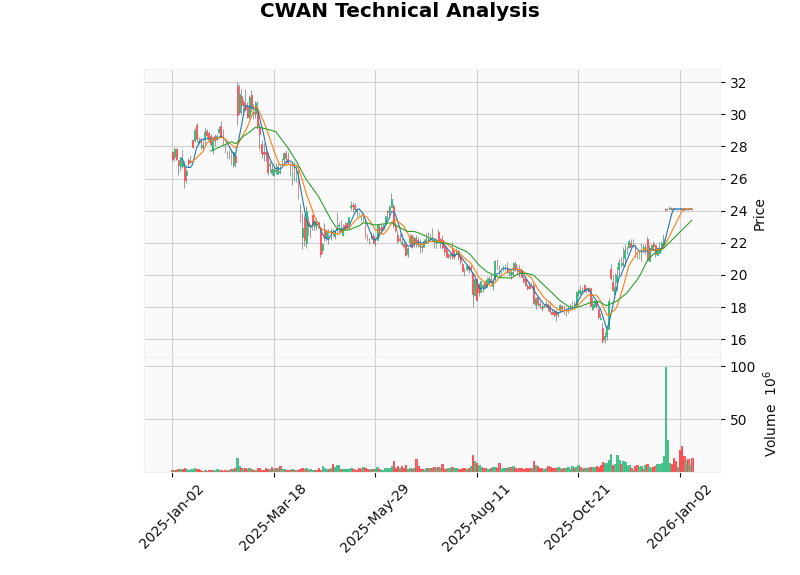
Based on technical analysis indicators[0]:
| Indicator | Value | Signal Interpretation |
|---|---|---|
Price |
$24.09 | Close to acquisition price of $24.55 |
MACD |
No crossover | Neutral to bearish |
KDJ |
K:38.2, D:46.2 | Weak oscillation |
RSI |
Overbought risk zone | Potential short-term pullback |
Trend Judgment |
Sideways consolidation | No clear direction |
Support Level |
$23.40 | Strong support |
Resistance Level |
$24.28 | Short-term resistance |
Technical indicators show that the stock price is
| Investor Type | Situation Analysis | Recommended Strategy |
|---|---|---|
Existing Shareholders |
Stock price is close to acquisition price, with limited premium | May continue holding until acquisition completion, or participate in the shareholder vote |
Potential Investors |
Limited premium margin, potential for superior offers during the Go-Shop period | Participate cautiously, monitor for superior proposals before January 23 |
Short-Term Traders |
Range-bound oscillation, increased trading volume | May operate within the $23.40-$24.28 range |
Institutional Investors |
Focus on voting rights and final transaction completion | Evaluate the risk of uncertainty regarding transaction completion |
- Transaction Completion Uncertainty: The acquisition is still subject to shareholder approval and regulatory clearance
- Superior Offers During Go-Shop Period: May lead to an increase in the acquisition price or termination of the current transaction
- Misinterpretation of Executive Tax Sales: Avoid misinterpreting regular equity incentive vesting as negative signals
- Strategic Opacity After Privatization: No regular disclosures will be made after becoming a private company
From this specific case, investors can learn the following key points about interpreting insider trading:
- Distinguish Transaction Types: Sell-to-cover for tax purposes should not be confused with active sell-offs
- Observe Transaction Proportions: Whether the executive retains sufficient equity risk exposure
- Compare Concurrent Transactions: Whether other executives have conducted similar transactions
- Combine with Corporate Events: Executive transactions before and after major events such as company acquisitions require special interpretation
- Focus on Trends in Share Holdings: Rather than the absolute number of shares in a single transaction
| Dimension | Assessment |
|---|---|
Insider Trading Signal |
Neutral - A regular sell-to-cover transaction for tax purposes, not an active sell-off |
Acquisition Premium |
1.91%, limited margin |
Technical Analysis |
Range-bound oscillation, support level at $23.40 |
Analyst Sentiment |
Recent downgrades dominate, cautious attitude |
Risk/Reward Ratio |
Medium-low risk, limited return potential |
[1] SEC EDGAR - Clearwater Analytics Form 8-K (2025-12-22). https://www.sec.gov/Archives/edgar/data/1866368/000095015725001016/form8-k.htm
[2] Whalewisdom - Form 4 Filing: Das Souvik (2026-01-05). https://whalewisdom.com/filing/das-souvik-4-2026-01-05-181441-0500-cwan
[3] NASDAQ - Clearwater Analytics CTO Executes Mandated Tax Sale After $8.4 Billion Acquisition Agreement. https://www.nasdaq.com/articles/clearwater-analytics-cto-executes-mandated-tax-sale-after-84-billion-acquisition-agreement
[4] StockTitan - CWAN CEO Insider Trading Activity. https://www.stocktitan.net/sec-filings/CWAN/form-4-clearwater-analytics-holdings-inc-insider-trading-activity-25d05b2cc15a.html
[0] Jinling AI Market Data (real-time quotes, company profiles, technical analysis)
Insights are generated using AI models and historical data for informational purposes only. They do not constitute investment advice or recommendations. Past performance is not indicative of future results.
About us: Ginlix AI is the AI Investment Copilot powered by real data, bridging advanced AI with professional financial databases to provide verifiable, truth-based answers. Please use the chat box below to ask any financial question.