In-Depth Analysis Report on Abnormal Stock Price Fluctuations of Western Metal Materials (002149.SZ)
Unlock More Features
Login to access AI-powered analysis, deep research reports and more advanced features
About us: Ginlix AI is the AI Investment Copilot powered by real data, bridging advanced AI with professional financial databases to provide verifiable, truth-based answers. Please use the chat box below to ask any financial question.
Related Stocks
Based on the data and analysis I have collected, here is a comprehensive analysis report for you.
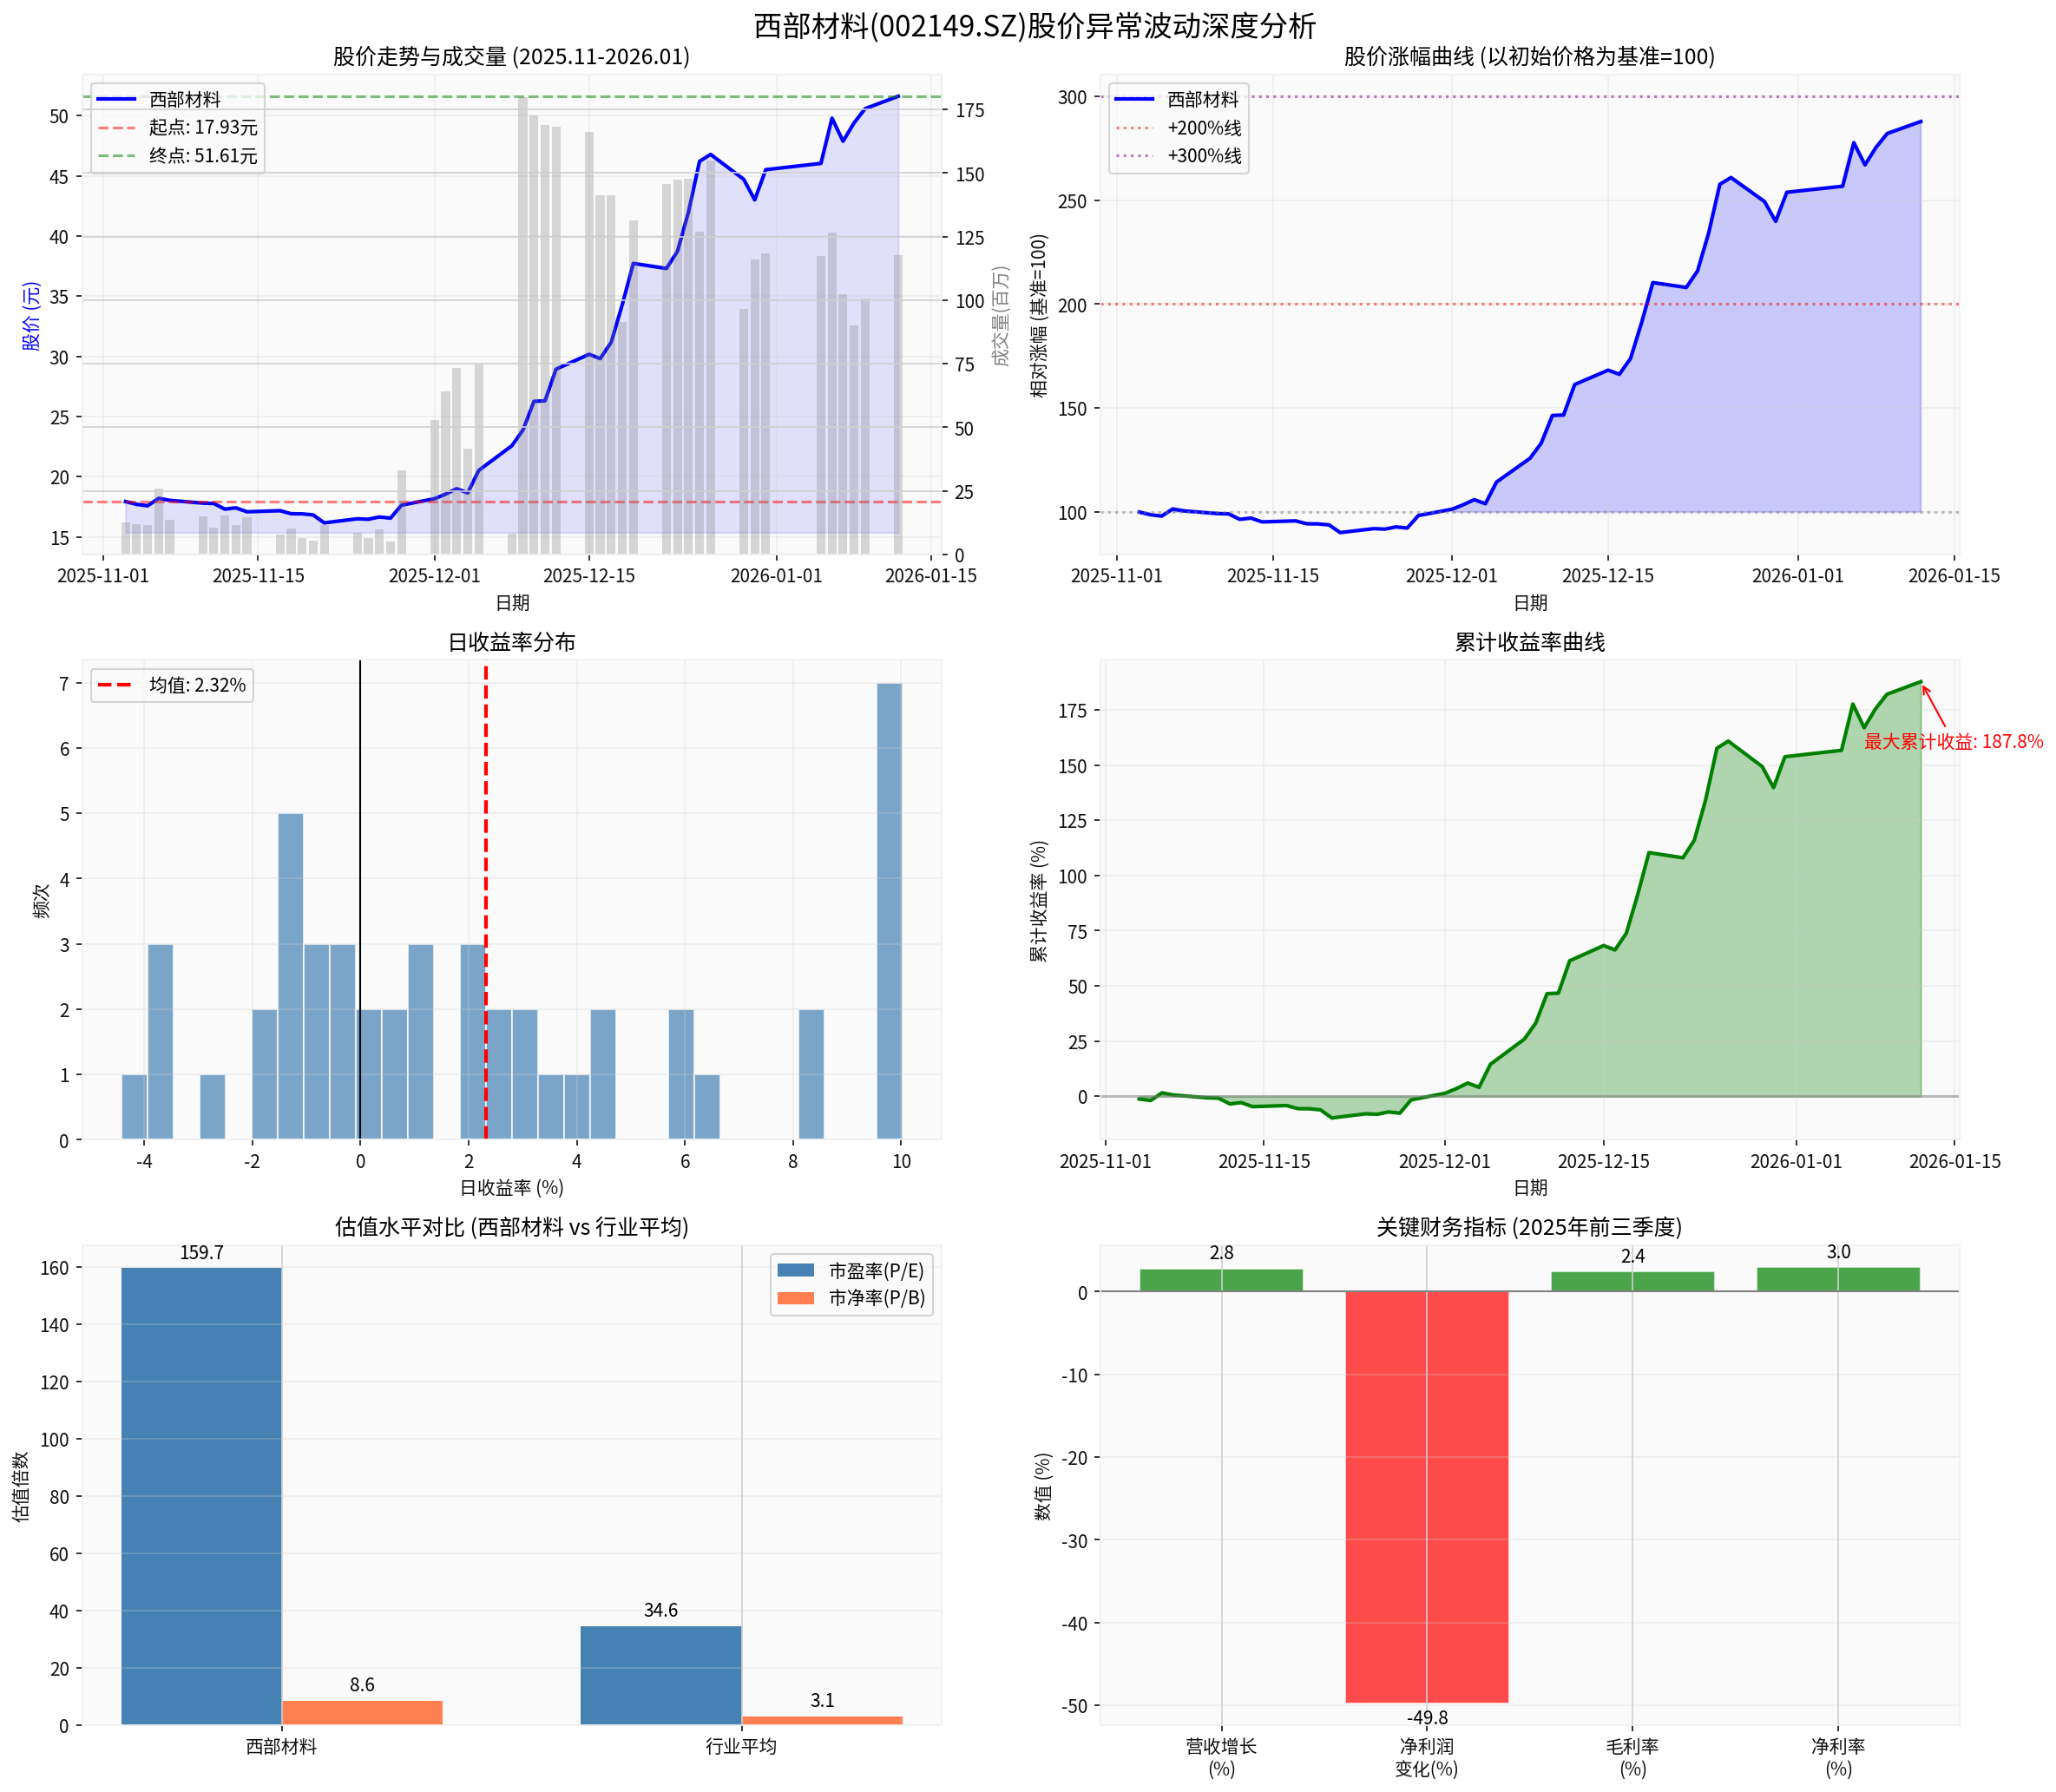
Based on market data analysis, Western Metal Materials experienced extremely abnormal price fluctuations between November 3, 2025, and January 12, 2026 [0]:
| Indicator | Value |
|---|---|
| Starting Price | RMB 17.93 |
| Closing Price | RMB 51.61 |
| Highest Price | RMB 52.63 |
| Lowest Price | RMB 16.08 |
Total Increase |
187.84% |
| Trading Days | 49 trading days |
| Average Daily Increase | 2.317% |
| Standard Deviation of Daily Returns | 4.36% |
| Maximum Single-Day Increase | 10.03% |
| Maximum Single-Day Decrease | -4.42% |
| Average Daily Trading Volume | 74.09 million shares |
| Total Trading Turnover | RMB 12.754 billion |
On January 12, 2026, the company issued an announcement on severe abnormal stock price fluctuations and risk warnings, confirming that the cumulative increase in the stock’s closing price deviation from November 28, 2025, to January 12, 2026, reached 200% over 30 consecutive trading days [1].
On January 6, 2026, the Ministry of Commerce officially strengthened export controls on dual-use items to Japan, prohibiting all relevant materials from flowing to Japanese military users and for military purposes [2]. This policy directly benefits Chinese strategic rare metal enterprises:
- Japan’s dependence on China for medium and heavy rare earths, gallium, germanium and other key materials exceeds 85%, with some categories close to 100%
- It will take at least 5-8 years to form large-scale alternative production capacity globally
- China controls 92.3% of the world’s rare earth smelting and separation capacity, with technology leading Japan by 15 years
As a leading enterprise in the field of titanium alloys and rare metal composite materials, Western Metal Materials has strong military supporting capabilities and is classified by the market as a direct beneficiary of the policy [2].
The rare metal and minor metal sectors performed strongly during the same period, forming an obvious sector driving effect:
| Related Company | Performance in the Same Period | Benefit Logic |
|---|---|---|
| Yunnan Germanium Industry | Hit a new high | Full layout of the germanium industry chain |
| Oriental Tantalum Industry | Hit a new high | Leading enterprise in beryllium products |
| Xiamen Tungsten Industry | Hit a new high | Leading enterprise in the tungsten industry chain |
| Northern Rare Earth | Rallied sharply | Leading enterprise in light rare earths |
Market hotspots are concentrated in directions such as
Despite no major changes in the company’s fundamentals, market sentiment has driven concentrated capital inflows:
- Substantial net inflow of margin trading funds: In the first week of the year, margin trading funds saw a net inflow of RMB 85.78 billion in the first four trading days [4]
- Intensified stock game: Market trading volume has continuously maintained above RMB 2.5 trillion
- Rotation of hot concepts: The rare metal sector led the market with an increase of over 5%
However, Western Metal Materials was selected by the market and subject to concentrated capital speculation, showing obvious characteristics of
The company’s actual financial performance seriously diverges from the stock price increase:
| Financial Indicator | First Three Quarters of 2025 | Year-on-Year Change |
|---|---|---|
| Operating Revenue | RMB 2.283 billion | +2.82% |
| Net Profit | RMB 69.2544 million | -49.76% |
| Basic Earnings Per Share | RMB 0.1419 | Decreased |
| Gross Profit Margin | 2.41% | Relatively low |
| Net Profit Margin | 2.97% | Relatively low |
- The company clearly stated that there have been no major changes in its fundamentals [1]
- There is no major information that should be disclosed but has not been disclosed
- Operations are normal, and there have been no major changes in internal and external operating environments
- There is no need to correct or supplement previously disclosed information
| Valuation Indicator | Western Metal Materials | Industry Average | Premium Multiple |
|---|---|---|---|
| Static Price-to-Earnings (P/E) | 159.70x |
34.62x | 4.6x |
| Price-to-Book (P/B) | 8.64x |
3.10x | 2.8x |
The company’s valuation level is significantly higher than the industry average, and the cumulative stock price increase deviates from fundamentals [1].
According to the assessment of financial analysis tools [0]:
- Financial Attitude: Aggressive accounting treatment
- Free Cash Flow: Negative in the latest quarter (-RMB 36.16 million)
- Debt Risk: Medium risk
- Profit Quality: Questionable
| Technical Indicator | Value | Signal Interpretation |
|---|---|---|
| KDJ | K:91.9, D:90.0, J:95.9 | Severely overbought |
| RSI | In the overbought range | Risk warning |
| MACD | No death cross signal | Bullish trend |
| Beta Coefficient | 0.57 | Volatility lower than the market |
| Price Type | Price | Implication |
|---|---|---|
| Support Level | RMB 47.53 | Key short-term support |
| Resistance Level | RMB 52.63 | Historical high |
| Next Target | RMB 55.66 | Theoretical upward target |
Technical analysis shows that the stock price is in a
This surge is mainly driven by
- Genuine value investment: Based on the company’s intrinsic value
- Speculative hype: Based on market sentiment and capital games
When valuation deviates severely from fundamentals, the stock price will eventually return to its value. Historical experience shows:
- A surge is often followed by a sharp drop
- Investors who chase highs to buy may suffer significant losses
The company has issued two abnormal fluctuation announcements, and the management has clearly warned of risks [1][5]. Ordinary investors are often at a disadvantage in information acquisition, and may have already suffered losses when they realize the risk.
| Investor Type | Recommended Strategy |
|---|---|
Holding Investors |
Pay close attention to company announcements, set stop-profit and stop-loss levels, and consider reducing positions on rallies |
Cash Investors |
Strictly refrain from chasing highs to buy , wait for valuation regression before evaluating investment value |
Potential Investors |
Conduct in-depth research on the company’s fundamentals, wait for a more reasonable entry price |
| Warning Signal | Performance in This Case |
|---|---|
| Increase deviates from fundamentals | 200% increase, net profit down 50% |
| Company issues risk warnings | Two consecutive abnormal fluctuation announcements |
| Valuation deviates significantly from the industry | P/E is 4.6x the industry average |
| Technical indicators show overbought | KDJ J value of 95.9 |
| No major positive support | The company clearly denied major changes |
- Clear driving factors: Policy benefit expectations, overheated market sentiment, and concentrated capital speculation are the main driving factors
- No fundamental support: Net profit fell 49.76% year-on-year, seriously diverging from the stock price increase
- Extremely high valuation risk: 159.7x P/E, 8.64x P/B, far exceeding the industry average
- Severe technical overbought: Indicators such as KDJ show extreme overbought conditions
- Company actively issued risk warnings: The management has clearly warned of the risk of a sharp short-term decline
- It is recommended to gradually reduce positions and lock in profits
- Set trailing stop-losses to guard against sudden sharp drops
- Do not be tempted by expectations of “further increases”
- Absolutely do not chase highs to buy
- Be patient and wait for the valuation to return to a reasonable range
- If optimistic about the company’s long-term value, consider accumulating positions on dips after sufficient price adjustments
This round of surge is a typical case of
[0] Jinling AI Brokerage API Data - Western Metal Materials stock price data, financial analysis, technical indicators
[1] Announcement on Severe Abnormal Stock Trading Fluctuations and Risk Warning of Western Metal Materials Co., Ltd. - CFi.net (https://www.cfi.net.cn/p20260112002408.html)
[2] Upgrade of Dual-Use Item Controls to Japan! 4 Golden Main Lines + 12 Core Targets Exposed! - Eastmoney (https://caifuhao.eastmoney.com/news/20260107192127665556630)
[3] This Export Control on Japanese Military Use Benefits Rare Earths, Tungsten-Molybdenum, Lithium and Other Strategic Metals - Eastmoney (https://caifuhao.eastmoney.com/news/20260106235331670031210)
[4] China Merchants Securities: A-Share is Expected to Continue Its Uptrend, the Main Line of Technology + Cycle Bull in January Will Not Change - Sina Finance (https://finance.sina.com.cn/stock/report/2026-01-11/doc-inhfxvtm9125030.shtml)
[5] Western Metal Materials: The Company’s Stock Price Has Risen Sharply in the Short Term and May Involve Irrational Speculation - Eastmoney (https://finance.eastmoney.com/a/202601123616018051.html)
Insights are generated using AI models and historical data for informational purposes only. They do not constitute investment advice or recommendations. Past performance is not indicative of future results.
About us: Ginlix AI is the AI Investment Copilot powered by real data, bridging advanced AI with professional financial databases to provide verifiable, truth-based answers. Please use the chat box below to ask any financial question.