Small-Cap Leadership Emergence: S&P 600 and S&P 400 Outperform S&P 500 in Early 2026 Rotation
Unlock More Features
Login to access AI-powered analysis, deep research reports and more advanced features
About us: Ginlix AI is the AI Investment Copilot powered by real data, bridging advanced AI with professional financial databases to provide verifiable, truth-based answers. Please use the chat box below to ask any financial question.
Related Stocks
The MoneyShow Chart of the Day from Seeking Alpha provides compelling evidence of a significant market rotation as small-cap and mid-cap indices substantially outperform large-cap benchmarks in early 2026 [1]. The S&P 600 Index (small-cap) leads with approximately +5% gains year-to-date, followed by the S&P 400 Index (mid-cap) at +4.6%, while the S&P 500 Index (large-cap) has managed only +1.8% [1]. This nearly 3-percentage-point spread between small-cap and large-cap performance represents one of the most pronounced leadership changes in recent market history.
Market data from internal analytical databases confirms this rotation narrative with the Russell 2000 (IWM), the primary small-cap benchmark, delivering a +5.30% gain over the approximately 29 trading days ending January 9, 2026, compared to the S&P 500’s +2.11% gain over the same period [0]. The technical indicators for IWM show the stock trading above both its 20-day moving average ($252.28) and 50-day moving average ($246.97), with the 200-day average at $226.19, indicating sustained bullish momentum [0]. Average daily volume of 33.17 million shares demonstrates strong institutional participation in this move [0].
The sector performance data for January 9, 2026, validates the small-cap rotation thesis, with traditionally small-cap weighted sectors leading the market: Real Estate (+1.36%), Industrials (+1.33%), Basic Materials (+1.28%), and Consumer Cyclical (+1.23%) all outperformed the broader market [0]. Conversely, sectors with heavy large-cap tech weighting—Communication Services (-0.07%), Healthcare (-0.64%), Financial Services (-0.97%), and Energy (-1.58%)—lagged significantly [0]. This sector performance pattern suggests capital is rotating from mega-cap growth names toward more economically sensitive, domestically focused small and mid-cap companies.
The IWM’s trading range of $174.82 to $260.23 (a 48.86% range) with daily volatility at 1.40% indicates elevated but manageable risk appetite [0]. The fact that the index has sustained above its 50-day moving average for an extended period suggests this is not merely a short-term bounce but potentially the beginning of a sustained leadership change [0].
Small-cap stocks are trading at approximately 18x forward price-to-earnings compared to 24x for the S&P 500, representing roughly a 22% discount that is near historic lows [4][5]. This valuation gap has expanded because small-cap earnings growth has been disappointing, but analysts now forecast meaningful earnings acceleration—Bank of America projects 17% earnings growth for small firms versus 14% for large caps in 2026 [3][5]. The S&P MidCap 400 is expected to see 14.3% earnings growth in 2026 and 20% in 2027, with forward earnings reaching record highs [4]. The S&P 600 is penciled in for 15.5% earnings growth in 2026, though expectations moderate to 3.3% in 2027 [4].
A critical factor driving this rotation is the expected reversal of earnings trends. According to Yardeni Research, forward earnings for the S&P 400 and S&P 600 have been mostly flat since late 2022, while the S&P 500’s forward earnings surged to record highs [4]. This divergence was largely attributable to large-cap companies acquiring the most promising small-cap targets before their earnings acceleration [4]. However, recent weeks have shown improvement in small-cap forward earnings, suggesting the trend may be reversing [4].
This rotation represents a potential end to the longest small-cap underperformance streak in modern market history. Data from Nasdaq shows that small caps have beaten large caps by an average of 2.85% annually since 1927, and for every 10-year investing window, small caps beat large caps two-thirds of the time [2]. The current 15-year streak of small-cap underperformance is described as an “historical anomaly” by multiple analysts [2][4]. This context suggests the current outperformance may reflect mean reversion rather than a fundamentally new market regime.
Wall Street strategists point to falling interest rates and the prospect of a more dovish Federal Reserve in 2026 as primary tailwinds for small caps [3]. Small-cap companies, typically more sensitive to financing costs, stand to benefit disproportionately from rate normalization. The market appears to be pricing in these expectations several months in advance, consistent with historical patterns [3]. Given that small-cap companies typically carry higher debt loads and rely more heavily on credit markets, any deviation from expected rate cuts could disproportionately impact this segment.
The concentration risk in mega-cap technology (particularly the “Magnificent 7”) has prompted institutional investors to seek diversification [3][4]. BTIG’s Jonathan Krinsky notes that small caps outperforming the Magnificent 7 will be a theme to watch in 2026, especially as investors take profits in Big Tech given valuation concerns [3]. Oppenheimer’s 2026 outlook specifically highlights opportunities in “U.S. small cap value” as compelling, noting that outside megacap technology, attractive valuations exist in areas that have been left behind [5].
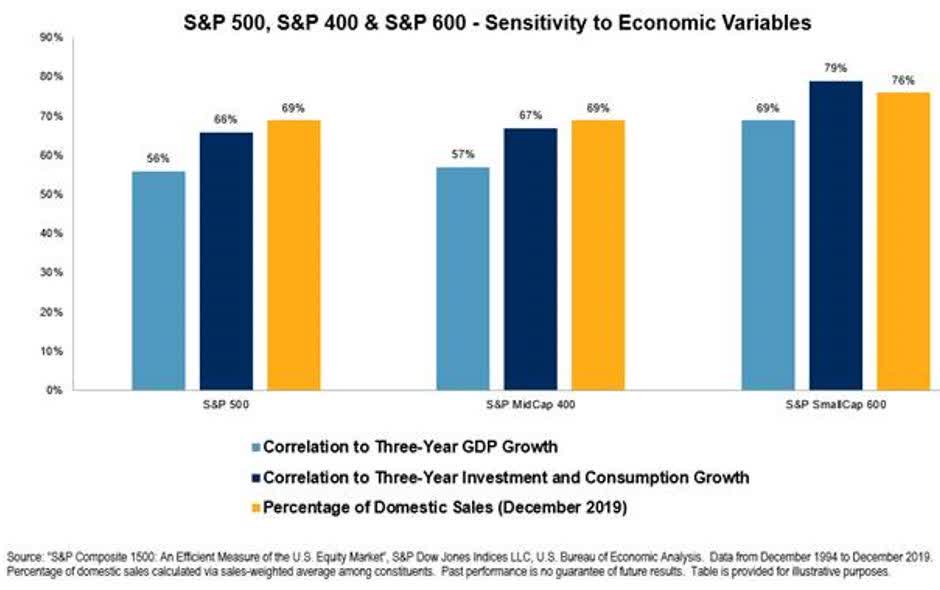
Small-cap stocks generate approximately 80% of their revenue from the United States, making them a proxy for domestic economic health [5]. The rotation gained momentum following peak pessimism around April 8, 2025, when recession fears stemming from tariff policies dominated market sentiment [5]. As tariff implementation schedules softened and preliminary trade deals emerged, investor enthusiasm for small-caps returned as economic expectations recalibrated toward growth [5].
The convergence of multiple favorable factors creates a compelling opportunity window for small-cap exposure. The valuation discount of approximately 22% relative to large caps represents meaningful upside potential if earnings convergence occurs as projected [4][5]. The expected Federal Reserve rate normalization could disproportionately benefit small caps given their higher interest rate sensitivity [3]. Additionally, institutional portfolio rebalancing away from mega-cap concentration could drive continued capital flows into underweighted small-cap positions.
Several risk factors warrant careful monitoring. While analyst expectations for small-cap earnings growth are optimistic, historical accuracy of forward projections varies significantly. The S&P 600’s projected earnings growth drops dramatically from 15.5% in 2026 to just 3.3% in 2027, suggesting analyst confidence diminishes substantially in outer periods [4]. Investors should monitor quarterly earnings reports to confirm whether projected growth materializes.
Franklin Templeton’s Royce Investment Partners cautions that the sharp multiple expansion among lower-quality small-cap companies—those with low return on invested capital, no profits, or speculative profiles—may lead to leadership transitioning toward higher-quality companies [5]. This suggests the current rally may have speculative components that could reverse as risk appetite normalizes.
Bank of America’s Jill Carey Hall notes that the Russell 2000 is currently trading as if ISM manufacturing data is better than it actually is [3]. The absence of a manufacturing recovery represents a risk to small-cap outperformance if economic data disappoints [3].
The current rotation appears sensitive to several time-dependent factors, including Federal Reserve policy decisions, earnings season releases, and evolving trade policy developments. The window for capitalizing on this rotation may narrow as expectations become priced in or as key catalysts are either realized or delayed.
The market data reveals a significant small-cap leadership emergence in early 2026, with the S&P 600 Index gaining approximately +5% year-to-date versus the S&P 500’s +1.8% as of late last week [1]. This performance divergence is corroborated by Russell 2000 technical indicators showing sustained bullish momentum above key moving averages [0]. Multiple factors are driving this rotation, including attractive small-cap valuations (18x forward P/E versus 24x for S&P 500), expected earnings acceleration (projected 17% growth versus 14% for large caps), Federal Reserve rate normalization benefiting rate-sensitive small caps, and institutional portfolio diversification away from mega-cap concentration [3][4][5].
The rotation represents a potential structural shift from the 15-year small-cap underperformance trend, which analysts characterize as a historical anomaly given that small caps historically outperform in approximately two-thirds of 10-year periods [2]. However, risks remain including earnings sustainability concerns, speculative components in the rally, manufacturing sensitivity, and the need for continued economic confirmation. The first quarter of 2026 will be critical for validating whether this rotation represents a sustained leadership change or a short-term reversion.
Insights are generated using AI models and historical data for informational purposes only. They do not constitute investment advice or recommendations. Past performance is not indicative of future results.
About us: Ginlix AI is the AI Investment Copilot powered by real data, bridging advanced AI with professional financial databases to provide verifiable, truth-based answers. Please use the chat box below to ask any financial question.