Analysis of the Impact of U.S. Policy Uncertainty toward Iran on Energy Markets and Oil & Gas Stock Investment Outlook
Unlock More Features
Login to access AI-powered analysis, deep research reports and more advanced features
About us: Ginlix AI is the AI Investment Copilot powered by real data, bridging advanced AI with professional financial databases to provide verifiable, truth-based answers. Please use the chat box below to ask any financial question.
Related Stocks
Based on the comprehensively collected data and analysis above, I will provide you with a detailed investment research report.
According to the latest reports, there are significant divisions in the U.S. Congress over military actions against Iran.
| Policy Scenario | Likelihood | Market Impact |
|---|---|---|
| Limited Military Strike (Targeted Elimination/Cyber Attack) | Medium | Oil prices surge short-term then retrace |
| Full-scale Military Operation | Low | Oil prices rise sharply, energy stocks see increased volatility |
| Maintain Status Quo + Escalated Sanctions | High | Oil prices face downward pressure, energy stocks fluctuate moderately |
| Breakthrough in Diplomatic Negotiations | Low | Oil prices decline moderately |
The current international crude oil market faces the severe challenge of
- WTI crude futures fell nearly 20% in 2025, marking the worst annual performance since the 2020 pandemic
- Brent crude fluctuated between $58 and $83 per barrel throughout the year, with an annual decline of over 18%, setting the record for the longest monthly losing streak since 2014
- On the last trading day of December 2025, WTI crude fell below $58 per barrel [3]
The global energy supply landscape is undergoing a
| Supply Source | 2025 Production Contribution | Market Impact |
|---|---|---|
| Non-OPEC+ Countries | +1.7 million barrels per day | Breaks OPEC’s monopoly |
| Brazil | Exceeded 4 million barrels per day for the first time | Potential to become the world’s third-largest oil producer |
| Guyana | Approximately 750,000 barrels per day (peak over 900,000 barrels per day) | Production increased nearly tenfold in five years |
| U.S. Shale Oil | Approximately 8.4 million barrels per day | World’s largest oil producer |
The U.S. Energy Information Administration (EIA) pointed out that approximately 70% of the global crude oil supply growth in 2025 came from unconventional energy sources such as U.S. shale oil, Brazilian deep-sea resources, and Guyana [5]. This means that even if a large-scale conflict breaks out in the Middle East causing partial supply disruptions, production capacity in other regions of the world is sufficient to fill the gap, and the substantive threat of geopolitical risks to supply has been significantly reduced.
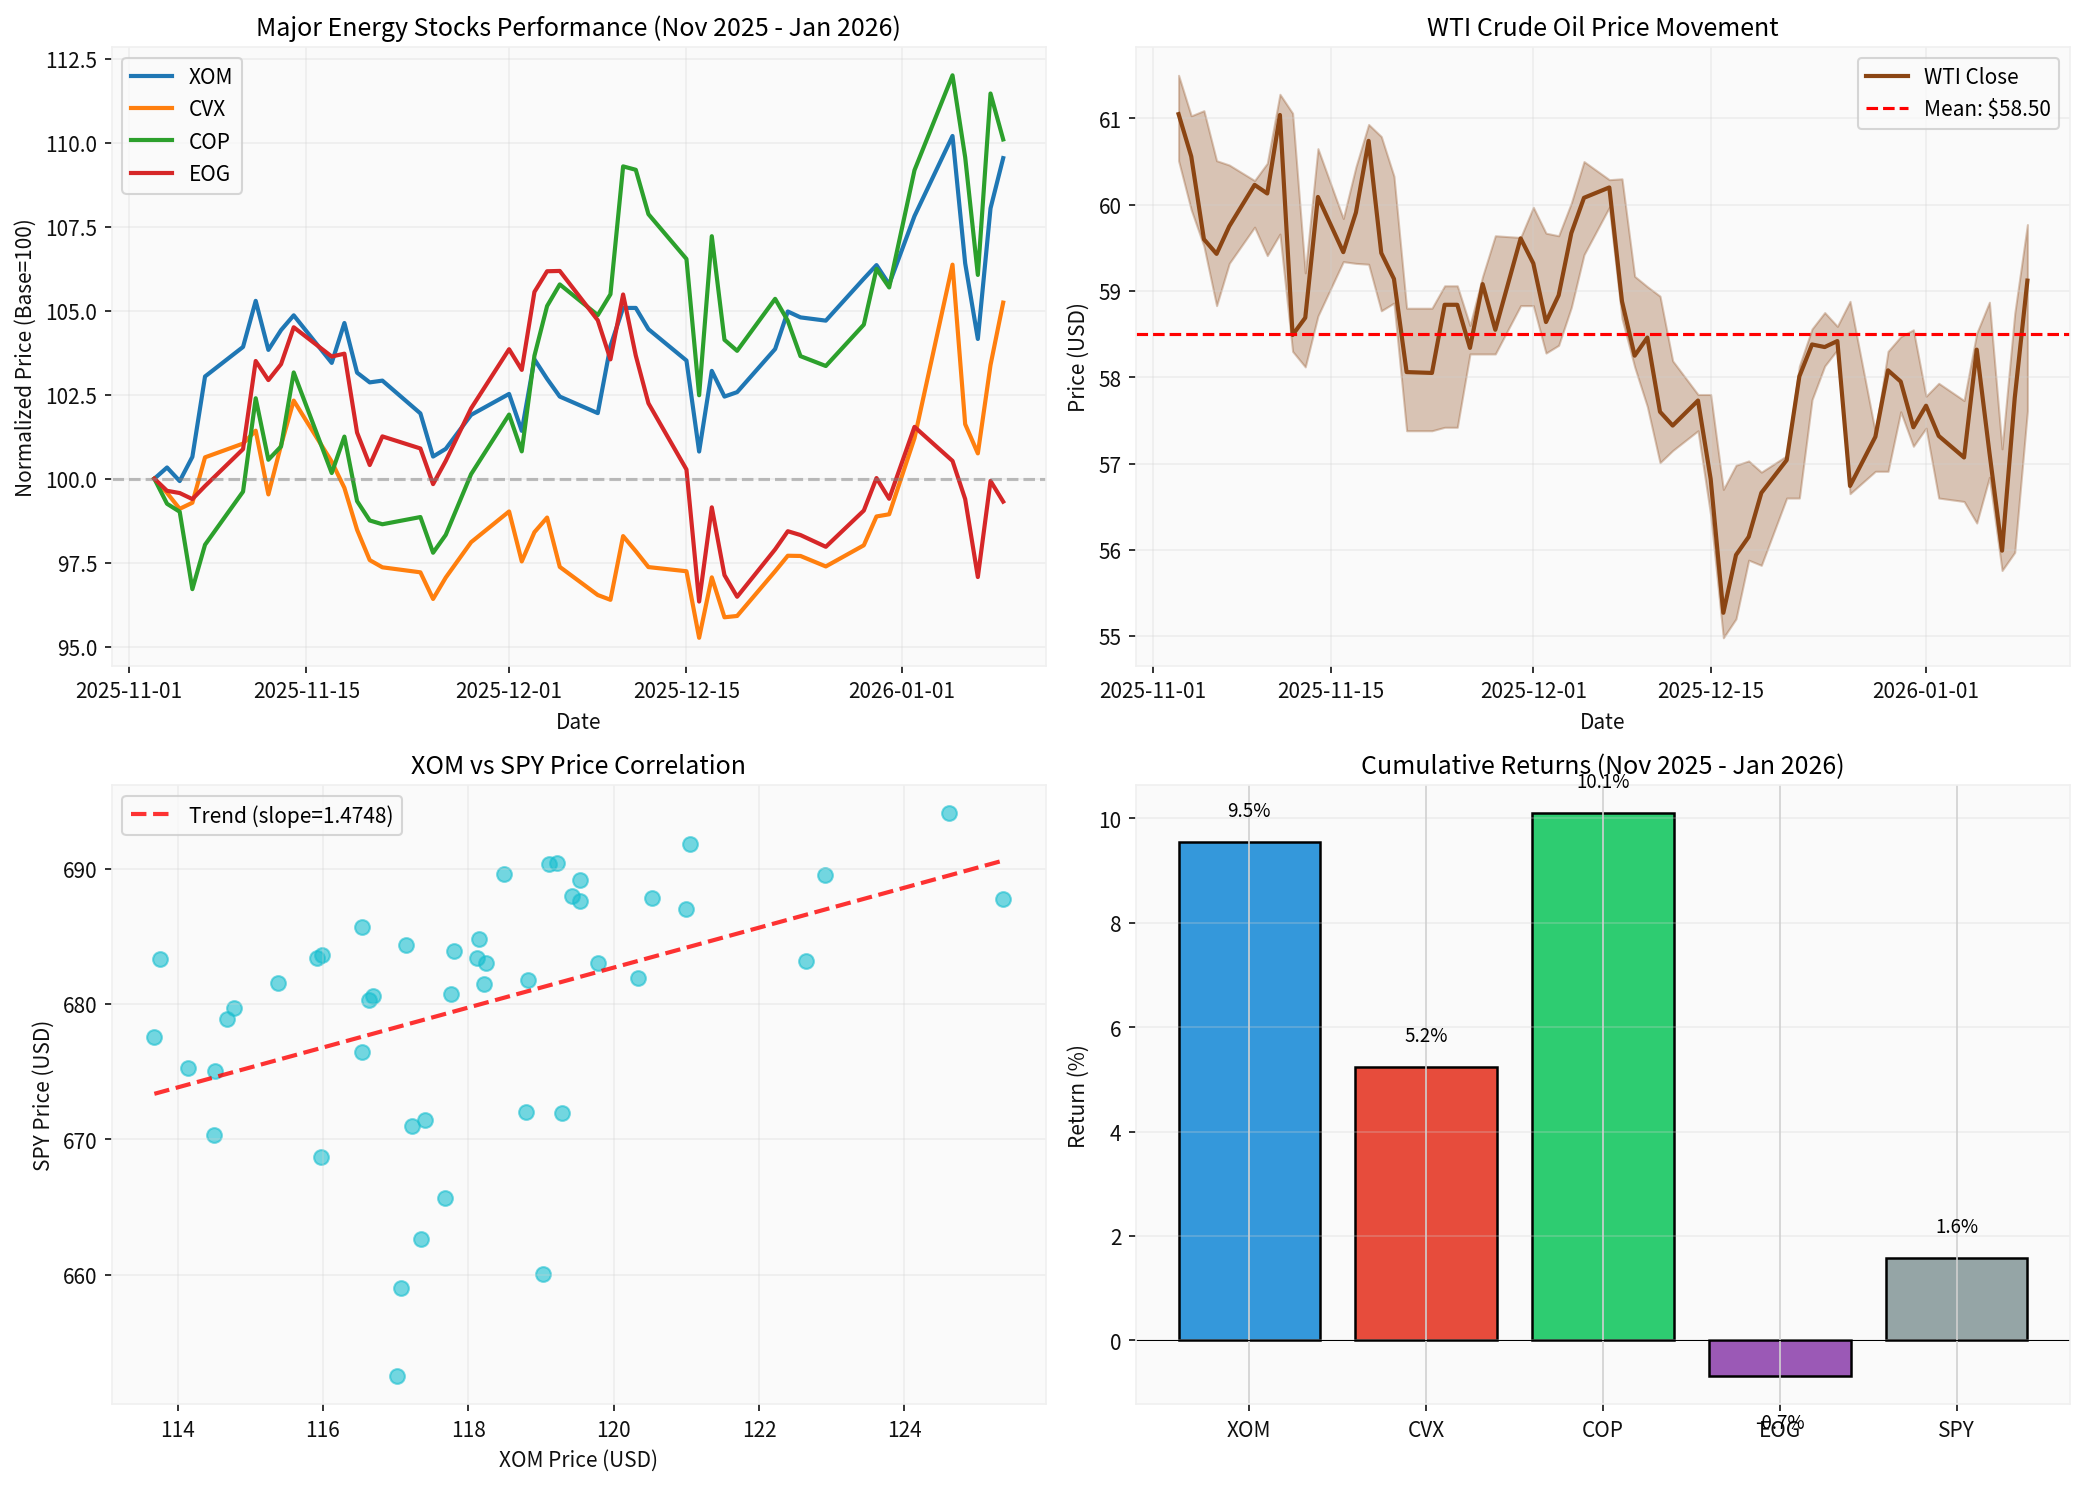
According to market data, major oil and gas stocks showed divergent performance between November 2025 and January 2026 [6]:
| Ticker | Company Name | Period Return | Annualized Volatility | Rating |
|---|---|---|---|---|
| XOM | Exxon Mobil | +9.54% | 21.8% | Hold (50.9%) |
| CVX | Chevron | +5.24% | 23.5% | Buy (62.7%) |
| COP | ConocoPhillips | +10.09% | 26.2% | - |
| EOG | EOG Resources | -0.68% | 24.8% | - |
| SPY | S&P 500 ETF | +1.57% | 12.3% | - |
- Oil and gas stocks outperformed the broader market as a whole (SPY rose 1.57%)
- Exploration and production companies (COP) performed the best, benefiting from high oil price sensitivity
- Integrated oil companies (XOM, CVX) provided stability through their downstream operations
As per the latest data,
- Price Risk: Sustained downward pressure on oil prices weakens the profit outlook for upstream companies
- Policy Uncertainty: The combination of multiple factors including U.S. policy toward Iran, the situation in the Middle East, and U.S. domestic energy policies
- Valuation Pressure: Although XOM and CVX have P/E ratios of 18.02x and 22.86x respectively, they lack attractiveness compared to other defensive sectors
- Market Cap: $525.54 billion, Current Stock Price: $124.62
- Analyst Consensus: Hold, Target Price: $142.00 (+13.9% upside potential) [7]
- Strengths: Refining business is considered undervalued by UBS, which is expected to boost cash flow
- Risks: Cautious about investments in Venezuela; CEO stated the country is “uninvestable”
- Market Cap: $324.16 billion, Current Stock Price: $162.13
- Analyst Consensus: Buy, Target Price: $172.00 (+6.1% upside potential) [7]
- Strengths: Has operations in Venezuela, poised to benefit from policy changes
- Recent earnings exceeded expectations (Q3 EPS $1.85 vs. consensus $1.69)
In recent years,
- Diversified Supply Sources: The U.S. shale oil revolution broke OPEC’s monopoly
- Slowing Demand Growth: The IEA expects global oil demand growth to slow from 1.2% in 2025 to 0.8% in 2026
- Development of Alternative Energy: The cost of renewable energy continues to decline, eroding oil’s share as an energy source
The ongoing protests in Iran (which broke out in late December 2025 due to economic hardship) have not yet caused substantial damage to oil facilities. Iran’s crude oil production and exports remain at the level of
- Sanction Enforcement: The U.S. Department of the Treasury’s Office of Foreign Assets Control (OFAC) will continue to crack down on shadow fleets and facilitators
- Risk of Military Conflict: If the conflict escalates to threaten the Strait of Hormuz (a chokepoint for 30% of global seaborne oil trade), oil prices may experience short-term sharp fluctuations
- China Factor: Most of Iran’s oil is exported to China; the effectiveness of sanctions depends on China’s level of cooperation
| Scenario | Probability | Oil Price Forecast | Oil & Gas Stock Performance | Recommendation |
|---|---|---|---|---|
Base Scenario : Maintain Status Quo + Sanctions |
55% | $50-60 | Neutral to Weak | Hold high-quality blue-chip stocks |
Bullish Scenario : Escalation of Geopolitical Conflict |
20% | $70-80 | Short-term Strength | Buy upstream stocks with high price sensitivity |
Bearish Scenario : Worsening Oversupply |
20% | $40-50 | Under Pressure | Reduce positions or hedge |
Outlier Scenario : U.S.-Iran Reconciliation |
5% | $45-55 | Moderate | Focus on downstream refining stocks |
- Prefer targets with low production costs: COP, EOG (U.S. shale oil costs approximately $40-50 per barrel)
- Avoid high-cost projects (e.g., Venezuelan heavy oil)
- Refining business provides price buffer: XOM, VLO (Valero Energy)
- Crack spreads benefit from supply-demand mismatches
- Orders for oilfield service companies such as SLB are positively correlated with drilling activity, facing short-term pressure
- Position Control: Limit the allocation ratio of the energy sector to 5-10% of the portfolio
- Hedging Strategy: Consider buying out-of-the-money put options to hedge against downside risks
- Diversification: Allocate to different regional exposures (U.S./International/Emerging Markets)
- Key Catalysts to Monitor:
- January 30: XOM and CVX earnings reports (Q4 FY2025)
- Progress in Russia-Ukraine peace talks
- OPEC+ production policy
- Developments in U.S.-Iran negotiations
-
The direct impact of U.S. policy uncertainty toward Iran on the energy market is limited. Due to the diversification of global supply sources, the geopolitical risk premium has been significantly weakened. Unless the conflict directly threatens the Strait of Hormuz, it will be difficult for oil prices to see a trend-based rise.
-
Supply and demand fundamentals will dominate oil price movements. In 2026, oversupply pressure will persist, and the central oil price is expected to shift down to the $50-60 range. This will compress the profit margins of upstream oil and gas companies, but refining operations are expected to provide relative stability.
-
Divergence among oil and gas stocks will intensify. Integrated oil companies (XOM, CVX) have stronger defensive characteristics due to their diversified businesses and financial strength; exploration and production companies (COP, EOG) are more sensitive to oil prices, with greater volatility but also stronger elasticity.
-
Policy risks cannot be ignored. U.S. efforts to bring Venezuelan oil back to the market, potential adjustments to sanctions, and changes in domestic energy policies could all reshape the competitive landscape.
| Target | Rating | Target Price | Rationale |
|---|---|---|---|
| XOM | Hold | $142.00 | Undervalued refining business, stable cash flow |
| CVX | Buy | $172.00 | Potential from Venezuelan operations, reasonable valuation |
| COP | Hold | - | High upstream sensitivity, high volatility |
| XLE (Energy ETF) | Hold | - | Diversified allocation tool |
[1] Reuters - “Some US senators skeptical about military options for Iran” (https://www.reuters.com/world/middle-east/some-us-senators-skeptical-about-military-options-iran-2026-01-11/)
[2] The New York Times - “Senate Democrat Says a U.S. Strike on Iran Risks Strengthening Its Government” (https://www.nytimes.com/2026/01/11/us/politics/us-iran-strike-protests-warner.html)
[3] Securities Times - “From Venezuela to Iran: Why is the International Crude Oil Market Immune to Geopolitical Conflicts?” (https://www.stcn.com/article/detail/3578323.html)
[4] China Energy Network - “Production Growth Crushes Demand Growth! Analysts Warn: 2026 Crude Oil Market May See ‘Low First, High Later’” (https://www.cnenergynews.cn/article/4Pan5VtxDN1)
[5] Forex CNFOl - “Iran Cuts Internet to Suppress Protests; Geopolitical Risks and Fund Inflows Provide Dual Impetus” (http://forex.cnfol.com/jingjiyaowen/20260111/31932414.shtml)
[6] Jinling API - Market Data (Energy Sector Performance, Major Oil & Gas Stock Price Data)
[7] Jinling API - Company Profiles (XOM, CVX Financial Indicators and Analyst Ratings)
[8] Energy Intelligence - “Iran Protests Spread as Oil Exports Offer Scant Relief” (https://www.energyintel.com/0000019b-7f4b-dca1-a3ff-ffefd95e0000)
Insights are generated using AI models and historical data for informational purposes only. They do not constitute investment advice or recommendations. Past performance is not indicative of future results.
About us: Ginlix AI is the AI Investment Copilot powered by real data, bridging advanced AI with professional financial databases to provide verifiable, truth-based answers. Please use the chat box below to ask any financial question.