Jianghua Microelectronics (603078.SS) In-Depth Financial Analysis Report: Cash Flow and Financial Risk Assessment
Unlock More Features
Login to access AI-powered analysis, deep research reports and more advanced features

About us: Ginlix AI is the AI Investment Copilot powered by real data, bridging advanced AI with professional financial databases to provide verifiable, truth-based answers. Please use the chat box below to ask any financial question.
Related Stocks
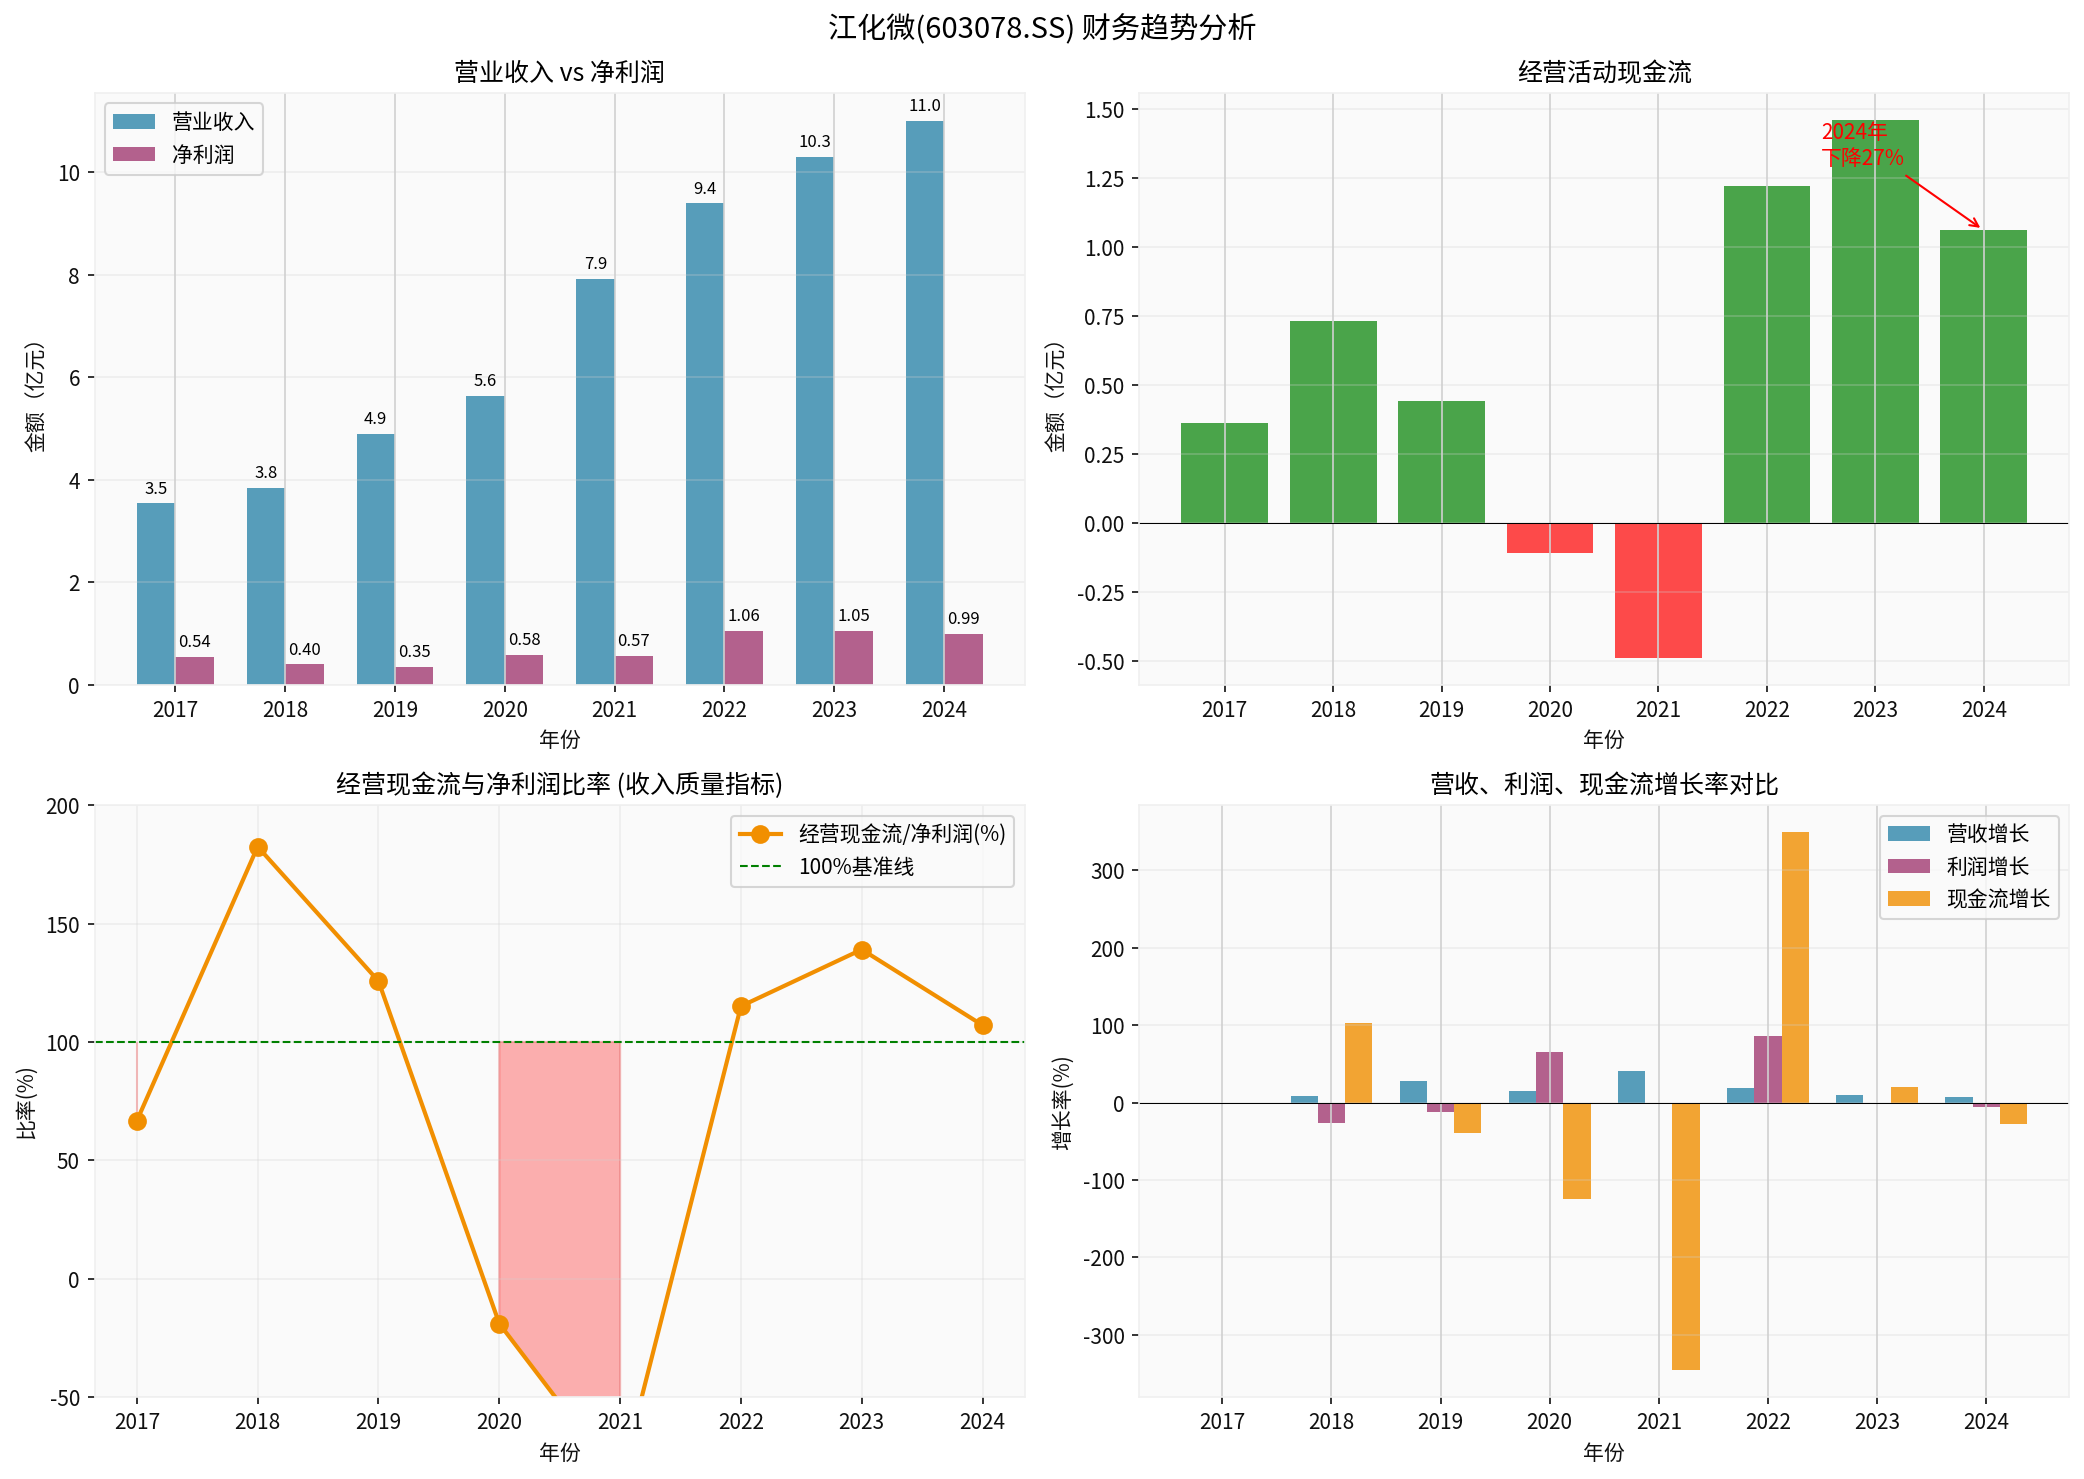
Based on the latest obtained financial data, a key fact needs to be clarified first:
| Core Indicator | 2024 | 2023 | YoY Change |
|---|---|---|---|
| Operating Revenue | 1.099 billion yuan | 1.030 billion yuan | +6.73% |
| Net Profit | 99 million yuan | 105 million yuan | -6.30% |
| Operating Cash Flow | 106 million yuan | 146 million yuan | -27.01% |
| Accounts Receivable | 432 million yuan | 389 million yuan | +11.13% |
| Inventory | 87 million yuan | 76 million yuan | +15.63% |
As can be seen,
Changes in working capital in 2024 resulted in a cash outflow of approximately
- Increase in Accounts Receivable: -105 million yuan (cash occupied by customers)
- Increase in Inventory: -23 million yuan (funds tied up in inventory)
- Increase in Accounts Payable: +42 million yuan (occupying suppliers’ funds)
The growth rate of accounts receivable (11.13%) is significantly higher than the revenue growth rate (6.73%), reaching
| Quality Indicator | 2024 | 2023 | Change |
|---|---|---|---|
| Operating Cash Flow / Net Profit | 107.7% | 138.3% | -30.6pp |
| Operating Cash Flow / Operating Revenue | 9.67% | 14.14% | -4.47pp |
Revenue quality indicators have deteriorated significantly, indicating that the “quality” of profits has declined [0].
- System assessment categorizes it as “conservative” accounting treatment[0]
- The high depreciation/capital expenditure ratio indicates that the company did not inflate profits by reducing provisions
- Instead, this treatment may result in the current profit being understated
- Despite the decline in cash flow, it remains positive(106 million yuan)
- No negative cash flow has occurred (only negative in 2020-2021 historically)
- Negative free cash flow is mainly due to increased capital expenditures (capacity expansion period)
- Current Ratio: 4.81(very healthy)
- Quick Ratio: 4.15(very healthy)
- Asset-Liability Ratio: 28.0%(low)
- Net Debt/EBITDA: 0.23(very low)
- Interest Coverage Ratio: 50.2x(very strong) [0]
Although no direct evidence of financial window-dressing has been found, the following anomalies deserve close attention:
| Warning Sign | Specific Performance | Risk Level |
|---|---|---|
| Excessively Fast Growth in Accounts Receivable | Growth rate is 1.7 times that of revenue | Medium |
| Excessively Fast Growth in Inventory | Growth rate is 2.3 times that of revenue | Medium |
| Decline in Cash Flow Quality | Operating Cash Flow/Net Profit ratio decreased by 30pp | Low |
| Extended Collection Period | Accounts receivable turnover days increased | Medium |
Jianghua Microelectronics’ main business is the R&D, production, and sales of wet electronic chemicals, mainly serving high-end manufacturing customers such as semiconductors and display panels.
- Strong Discourse Power of Downstream Customers: Customers in the semiconductor and panel industries usually have longer payment cycles and strong bargaining power
- Capacity Expansion Period: The company expanded its production capacity in 2024, and inventory increased due to stock preparation for new customers
- Industry Cycle Factors: The semiconductor industry was in a recovery period in 2024, and customers may have adjusted their procurement rhythms
- ✅ Conservative accounting treatment reduces window-dressing risks
- ✅ Cash flow remains positive despite the decline
- ✅ Robust debt structure with no debt repayment pressure
- ✅ No obvious anomalies in revenue recognition policies
However, the following signals require continuous attention:
- Accounts Receivable Quality: Monitor the risk of customer bad debts
- Inventory Impairment Risk: Monitor inventory turnover rate and impairment provisions
- Cash Flow Recovery: Whether the downward trend can be reversed in 2025
- Capital Expenditure Efficiency: Whether capacity expansion can be converted into revenue growth
- Monitor cash flow in quarterly performance pre-announcements
- Monitor accounts receivable aging analysis and bad debt provision in annual reports
- Monitor changes in inventory turnover rate and stock age
- Monitor changes in sales proportion of the top five customers
[0] Gilin AI Financial Database - Jianghua Microelectronics (603078.SS) Real-Time Quotes, Company Profile, Financial Analysis and Historical Financial Data (as of December 31, 2024)
Insights are generated using AI models and historical data for informational purposes only. They do not constitute investment advice or recommendations. Past performance is not indicative of future results.
About us: Ginlix AI is the AI Investment Copilot powered by real data, bridging advanced AI with professional financial databases to provide verifiable, truth-based answers. Please use the chat box below to ask any financial question.