Valuation Analysis Report on Jianghua Microelectronics (603078)
Unlock More Features
Login to access AI-powered analysis, deep research reports and more advanced features
About us: Ginlix AI is the AI Investment Copilot powered by real data, bridging advanced AI with professional financial databases to provide verifiable, truth-based answers. Please use the chat box below to ask any financial question.
Related Stocks
From the perspective of price-to-earnings ratio, I will systematically assess whether the current valuation fully reflects fundamental improvements from three dimensions: cash flow improvement, profitability, and valuation level.
| Year | Operating Cash Flow (RMB millions) | YoY Change | Quality Assessment |
|---|---|---|---|
| 2020 | -11.11 | - | Negative, Under Pressure |
| 2021 | -49.31 | -344% | Continuously Deteriorating |
| 2022 | +122.45 |
Turned Positive |
Significantly Improved |
| 2023 | +145.60 |
+19% |
Continuously Improving |
| 2024 | +106.26 | -27% |
Inflection Point Appeared |
| Year | Free Cash Flow (RMB millions) | FCF Margin | Status |
|---|---|---|---|
| 2020 | -288.01 | -51.1% | Severely Negative |
| 2021 | -279.07 | -35.2% | Continuously Under Pressure |
| 2022 | -93.65 | -10.0% | Significantly Narrowed |
| 2023 | +47.02 |
+4.6% |
Turned Positive for the First Time |
| 2024 | -68.81 | -6.3% | Turned Negative Again |
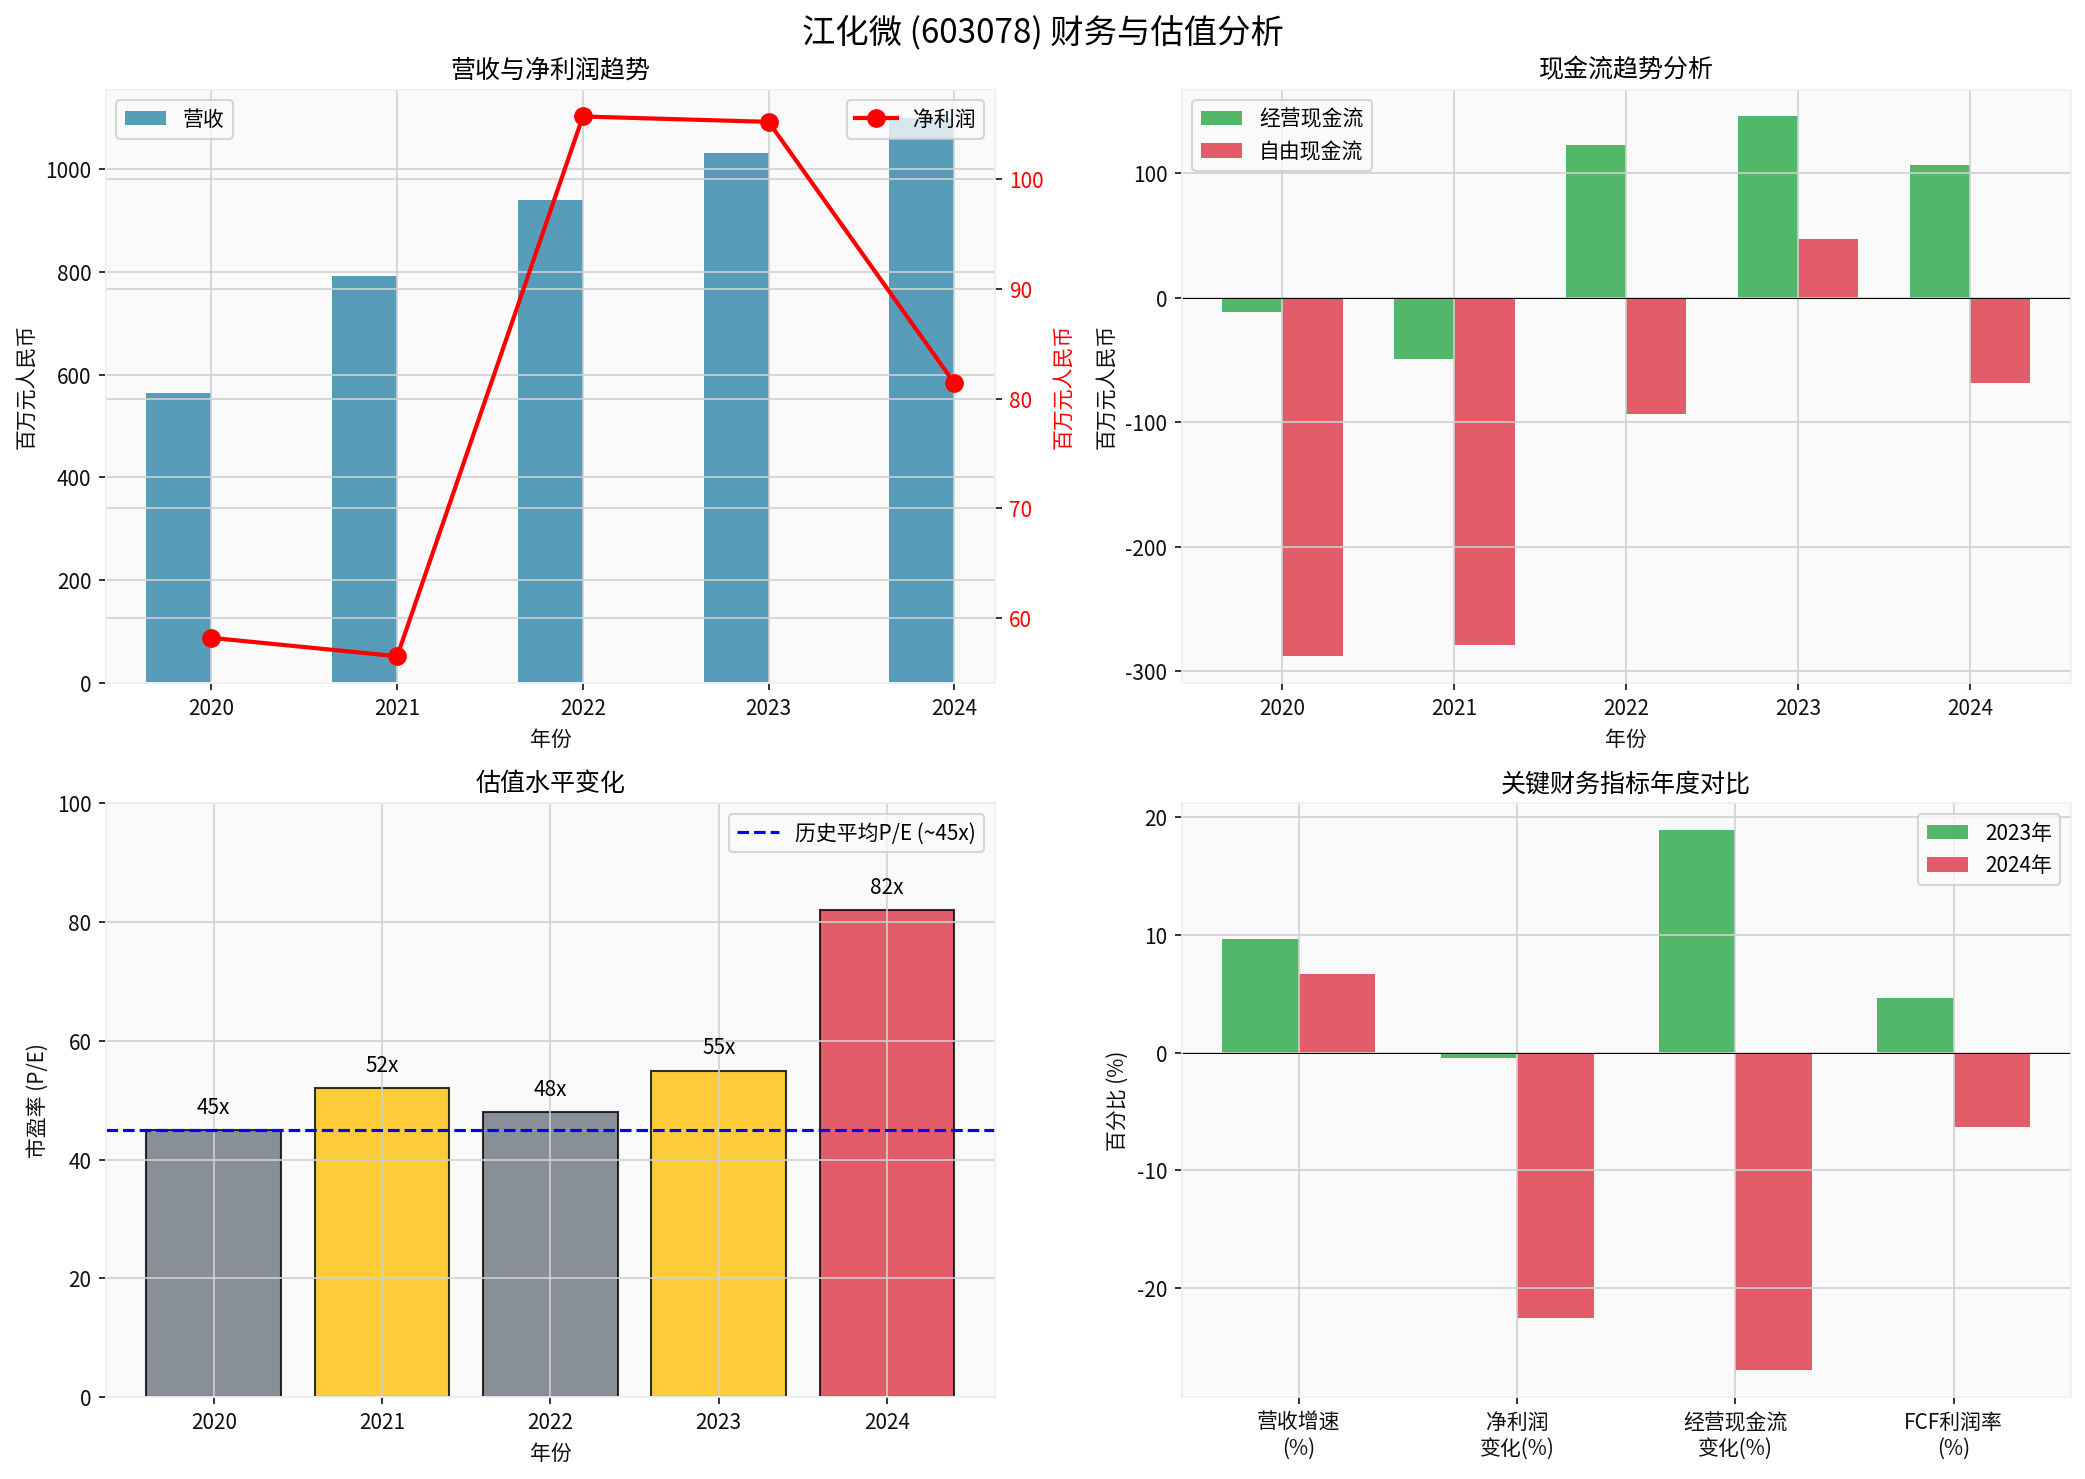
- Sustainability of Improvement is Doubtful: Although operating cash flow improved significantly between 2022-2023, it declined in 2024; free cash flow only turned positive briefly in 2023 before turning negative again [0].
- Cash Flow Quality: The ratio of operating cash flow to net profit was 1.16x, 1.38x, and 1.30x in 2022-2024 respectively, indicating acceptable earnings quality, but this advantage failed to translate into sustained free cash flow [0].
- Capex Fluctuations: Capex increased 77.6% year-on-year in 2024 (from RMB 986 million to RMB 1.751 billion), which was the direct cause of the negative FCF [0].
| Period | Revenue (RMB millions) | YoY Growth Rate |
|---|---|---|
| 2020→2021 | 563.79→792.14 | +40.5% |
| 2021→2022 | 792.14→939.16 | +18.6% |
| 2022→2023 | 939.16→1029.91 | +9.7% |
| 2023→2024 | 1029.91→1099.24 | +6.7% |
Revenue growth has shown a continuous downward trend, dropping from 40.5% in 2021 to 6.7% in 2024 [0].
- Net profit in 2024 was RMB 81.43 million, a 22.6% decreasecompared to RMB 105.25 million in 2023 [0]
- ROE was only 4.75%, which is at a low level [0]
- Net profit margin dropped from 10.2% in 2023 to 7.67% in 2024 [0]
Although operating cash flow outperformed net profit (ratio of approximately 1.3x), the downward trend of net profit itself indicates that the company’s core profitability has not substantially improved.
| Metric | Value | Industry Comparison | Assessment |
|---|---|---|---|
| P/E (TTM) | 82.36x |
Semiconductor Materials Industry: ~30-50x | Significantly High |
| P/B | 3.87x | Industry: ~2-3x | High |
| EV/OCF | 37.92x | Industry: ~15-25x | High |
| P/S | 6.32x | Industry: ~3-5x | High |
Based on historical data analysis, the historical average P/E of Jianghua Microelectronics is approximately
- The stock price has risen 27.25%since 2024, while net profit fell by approximately 23% during the same period [0]
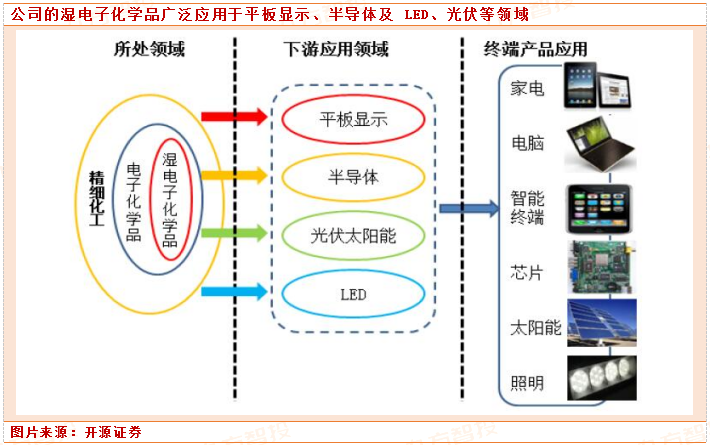
- Valuation expansion mainly comes from market speculation on the expectation of domestic substitution in the semiconductor wet chemicals industry
-
Insufficient Sustainability of Cash Flow Improvement
- Free cash flow only turned positive in 2023, and turned negative again in 2024
- Operating cash flow dropped by 27% in 2024
- The current valuation is based on the assumption of “sustained cash flow improvement”, but this assumption has not yet been verified
-
Divergence Between Profitability and Valuation
- Net profit has continued to decline (-22.6% YoY in 2024), while the valuation has hit a historical high
- An 82x P/E corresponds to an EPS of approximately RMB 0.24, indicating that the market expects substantial profit growth in the future
- However, revenue growth has dropped to single digits, and there is insufficient evidence of profitability improvement
-
Valuation Level Has Deviated Significantly from the Reasonable Range
- Current P/E 82x vs historical average 45x, 83% premium
- In comparison, peer comparable companies typically have a P/E in the 30-50x range
- EV/OCF of 37.9x is also at a relatively high level
-
Technical Signals Indicate Overbought Risk
- KDJ Indicator: K=74.2, D=65.8, J=90.9, indicating short-term overbought [0]
- The stock price is in a sideways consolidation range ($18.23-$19.72), with no clear trend [0]
- Beta=-0.35, negatively correlated with the broader market, with strong independent trend [0]
| Dimension | Assessment | Risk Warning |
|---|---|---|
| Valuation Risk | High |
82x P/E lacks fundamental support |
| Cash Flow Risk | Medium-High |
Sustainability of improvement is in doubt |
| Profit Risk | High |
Net profit continues to decline |
| Industry Outlook | Medium |
The logic of domestic substitution for semiconductor wet chemicals is valid, but competition is intensifying |
[0] Jinling AI Financial Database - Jianghua Microelectronics (603078.SS) Company Overview, Financial Analysis, Technical Analysis, Cash Flow Data (January 2026)
Insights are generated using AI models and historical data for informational purposes only. They do not constitute investment advice or recommendations. Past performance is not indicative of future results.
About us: Ginlix AI is the AI Investment Copilot powered by real data, bridging advanced AI with professional financial databases to provide verifiable, truth-based answers. Please use the chat box below to ask any financial question.