Assessment of the Impact of Iran's Geopolitical Tensions on the Global Energy Market and Oil & Gas Stocks
Unlock More Features
Login to access AI-powered analysis, deep research reports and more advanced features

About us: Ginlix AI is the AI Investment Copilot powered by real data, bridging advanced AI with professional financial databases to provide verifiable, truth-based answers. Please use the chat box below to ask any financial question.
Related Stocks
I will now provide you with a systematic and comprehensive analysis report:
Since December 28, 2025, Iran has experienced its most severe domestic unrest since 1979. The protests were initially triggered by economic distress—sharp depreciation of the Iranian rial, soaring inflation, and worsening poverty—and quickly evolved into a nationwide movement calling for the overthrow of the current regime [1][2].
According to human rights organizations, the protests have resulted in over 500 deaths and spread to more than 180 cities. Merchants and people in Tehran and other major cities took to the streets to protest economic distress and the currency crisis [2][3]. Iran’s Supreme Leader Khamenei commented on the matter on January 3, 2026, acknowledging that economic problems do exist but emphasizing that officials are working to resolve them [3].
Former U.S. President Trump has issued an ultimatum: if the Iranian authorities crack down on civilians, the U.S. will not stand by, and Iran will “pay a price” [2]. Meanwhile, the U.S. imposed a new round of sanctions on entities and individuals in Iran and Venezuela on December 30, 2025 [3].
However, analysts point out that the U.S. policy toward Iran faces complex considerations in the current environment. If the U.S. reimposes sanctions on Iran, it may need OPEC member states to agree to increase production to fill the gap, which could instead have a bearish impact on oil prices—this is fundamentally different from the situation in 2018 when sanctions caused a short-lived surge in oil prices [4].
Iran is an important oil-producing country in the Middle East, and its crude oil production and exports have a significant impact on global energy supply:
| Indicator | Value | Data Source |
|---|---|---|
| Daily crude oil production | 3.2-3.5 million barrels per day | [4][5] |
| Daily crude oil exports | 1.5-2.0 million barrels per day | [5] |
| Global production share | Approximately 3-4% | Industry estimates |
| Major export destinations | Mainly China | [5] |
In December 2025, UANI (United Against Nuclear Iran) tracked Iran’s actual exports at approximately 1.56 million barrels per day, with an average monthly export value of approximately $4.57 billion for the year [5]. Despite facing sanctions and military strikes, Iran’s oil exports have continued through means such as “shadow fleets” and maritime transshipment.
2025 became the year when the geopolitical risk premium “disappeared”. Despite multiple major geopolitical events, the market response was unusually muted [6][7]:
| Time | Event | Expected Impact | Actual Impact |
|---|---|---|---|
| June 2025 | Israel-Iran 12-Day War | Oil prices surge to triple digits | Brent briefly touched $78.85 before quickly falling back to $64 [6] |
| October 2025 | U.S. sanctions on two major Russian oil companies | Sharp rise in oil prices | Limited and short-lived reaction [6] |
| April 2025 | Ukraine’s attack on Russian refineries | Concerns over diesel shortages | The market barely reacted [6] |
| January 2026 | Iranian protests | Concerns over supply disruptions | Limited market reaction |
-
Extremely Ample Global Supply: U.S. crude oil production reached an all-time high of 13.84 million barrels per day in September 2025 [6][7]. Non-OPEC+ countries (Brazil, Guyana, Argentina, etc.) contributed approximately 30% of global supply growth.
-
Continuous Production Increase by OPEC+: OPEC+ continued to increase production throughout 2025, although it suspended production increases from January to March 2026, this was mainly a seasonal adjustment rather than production cuts to support prices [8].
-
Slowing Demand Growth: The IEA expects global oil demand growth to slow from 1.2% in 2025 to 0.8% in 2026 [9].
Based on forecasts from institutions such as the International Energy Agency (IEA), Goldman Sachs, and JPMorgan Chase [9][10]:
| Forecasting Institution | Brent Oil Price Forecast | WTI Oil Price Forecast | Supply and Demand Judgment |
|---|---|---|---|
| IEA | - | - | Oversupply of approximately 3.84 million barrels per day in 2026 |
| Goldman Sachs | $56/bbl | $52/bbl | Oversupply of approximately 2.0 million barrels per day |
| JPMorgan Chase | $58/bbl | $54/bbl | Supply growth rate is 3 times the demand growth rate |
- Brent crude oil: $50-$78 per barrel
- WTI crude oil: $45-$72 per barrel
Institutions generally believe that 2026 will be a “supply-dominated” year, and prices will fluctuate within the current range unless major supply disruptions or significant production cuts by OPEC+ occur.
OPEC+ announced on January 4, 2026 that it will maintain its production plans for February and March 2026 unchanged, which are the same as those for December 2025 and January 2026 [8]. This means:
- The 8 OPEC+ countries (with voluntary production cuts of approximately 2.2 million barrels per day) will continue to implement the current production level
- The production increase plan has been postponed to after April
- Production policies will be flexibly adjusted based on market conditions
Based on the latest market data [0]:
| Ticker | Ending Price | Period Return | Excess Return vs. S&P 500 | Annualized Volatility | Maximum Drawdown |
|---|---|---|---|---|---|
| XOM (ExxonMobil) | $124.61 | +9.54% | +7.84% |
22.37% | -5.48% |
| CVX (Chevron) | $162.11 | +5.24% | +3.61% |
24.11% | -6.90% |
| XLE (Energy ETF) | $46.67 | +5.90% | +4.26% |
21.26% | -5.13% |
| SPY (S&P 500 ETF) | $694.07 | +1.57% | Benchmark | 11.57% | -4.51% |
-
Oil & gas stocks significantly outperformed the broader market: XOM, CVX, and XLE all achieved positive excess returns, indicating a certain degree of market favor for the energy sector.
-
Higher volatility than the market: The annualized volatility of energy stocks is approximately 22-24%, nearly twice that of the S&P 500 (11.57%), reflecting the high-risk characteristics of this sector.
-
Controllable maximum drawdown: Despite high volatility, the maximum drawdown range is relatively limited (-5% to -7%), which is better than the crash scenario feared by some investors.
- Market capitalization: $525.54 billion
- P/E: 18.02x
- ROE: 11.42%
- Net profit margin: 9.03%
- Analyst consensus: Hold (target price $142.00, +13.9% from current price)
- Next earnings report: January 30, 2026 (Q4 FY2025), expected EPS $1.65
- Market capitalization: $324.16 billion
- P/E: 22.86x
- ROE: 8.01%
- Net profit margin: 6.78%
- Analyst consensus: Buy (target price $172.00, +6.1% from current price)
- Next earnings report: January 30, 2026 (Q4 FY2025), expected EPS $1.47
Industry performance as of January 10, 2026 shows [11] that the energy sector fell 1.59% on the day, performing the worst among the 11 sectors. This indicates:
- Short-term pullback pressure: Profit-taking occurred in the energy sector after the previous rally
- Market sentiment bias: Investors are cautious about the short-term outlook of energy stocks
- Divergence from the broader market: The sectors that rose on the day were Real Estate (+1.36%), Industrials (+1.32%), and Materials (+1.27%)
-
Iran’s supply not substantially affected: As of January 10, 2026, Iran’s crude oil production and exports remain at the level of 3.2-3.5 million barrels per day, and the protests have not caused major supply disruptions [4].
-
Reference to historical experience: In September 2019, the attack on Saudi oil fields caused a supply disruption of 5.7 million barrels per day (approximately 6% of global supply), but oil prices only surged for two days before falling back [7]. The current market has more abundant supply and stronger resilience to similar shocks.
-
Market expectations in advance: Investors have fully anticipated the Iranian situation, and the price already includes a risk premium. When expectations do not materialize into actual supply disruptions, prices may instead fall due to unmet expectations.
Although the short-term impact is limited, the following scenarios may cause significant market volatility:
| Scenario | Probability | Potential Impact | Price Change |
|---|---|---|---|
| Iranian production disruption (>0.5 million barrels per day) | Low | Supply tightens, but can be offset by OPEC+ production increases | +$5-$10/bbl |
| Strait of Hormuz disruption | Extremely Low | 20% of global oil transportation disrupted | +$20-$50/bbl |
| Escalation of U.S.-Iran military conflict | Medium-Low | Regional tensions rise, premium briefly increases | +$3-$8/bbl |
| Increased sanctions but stable production | Medium | Increased supply uncertainty | Volatility intensifies |
| Situation eases, sanctions reduced | Medium-High | Expectations of increased supply strengthen | -$3-$5/bbl |
-
Price transmission: Oil & gas stock prices are highly correlated with crude oil prices. If geopolitical events drive up oil prices, oil & gas stocks usually benefit; vice versa.
-
Production risk: If Iranian oil fields or infrastructure are damaged, it benefits oil & gas companies in other oil-producing countries (U.S., Saudi Arabia, Russia).
-
Impact on capital expenditure: Geopolitical risks may increase the capital expenditure of oil & gas companies (such as security costs, insurance premiums), putting pressure on profit margins.
-
M&A opportunities: Energy giants may take advantage of the crisis to acquire Iran-related assets or equity at low prices.
Based on the above analysis, we make the following judgments on the impact of Iran’s geopolitical risks on the energy market:
| Dimension | Assessment | Explanation |
|---|---|---|
Short-term price impact |
Limited | Oversupply dominates, geopolitical premium is limited |
Short-term stock price impact |
Neutral bullish | Oil & gas stocks have already reflected excess returns |
Medium-term fundamentals |
Weak | Oversupply persists, demand growth slows |
Risk premium |
Low | The market has fully priced in risks |
Volatility |
Medium | Event-driven volatility dominates |
- Maintain a standard or under-allocation to the energy sector
- Prioritize financially sound, reasonably valued tickers (such as XOM)
- Focus on dividend income (XOM and CVX both offer attractive dividends)
- Consider buying on dips when the market overreacts
- Focus on ETFs such as XLE to diversify individual stock risks
- Use option strategies to hedge tail risks
- OPEC+ production policy: The production increase plan after April will be a key variable
- U.S. policy toward Iran: Enforcement intensity and scope of sanctions
- Iran’s production data: Changes in actual exports
- Global economic data: Changes on the demand side
- Seasonal factors: Refinery maintenance period (February-March) affects demand
- Oversupply risk: If OPEC+ maintains high production, oil prices may fall further
- Weak demand risk: Global economic slowdown may lead to lower-than-expected demand
- Escalation of geopolitical events: If the situation worsens beyond expectations, it may cause short-term violent fluctuations
- Valuation risk: The current P/E level has partially reflected optimistic expectations
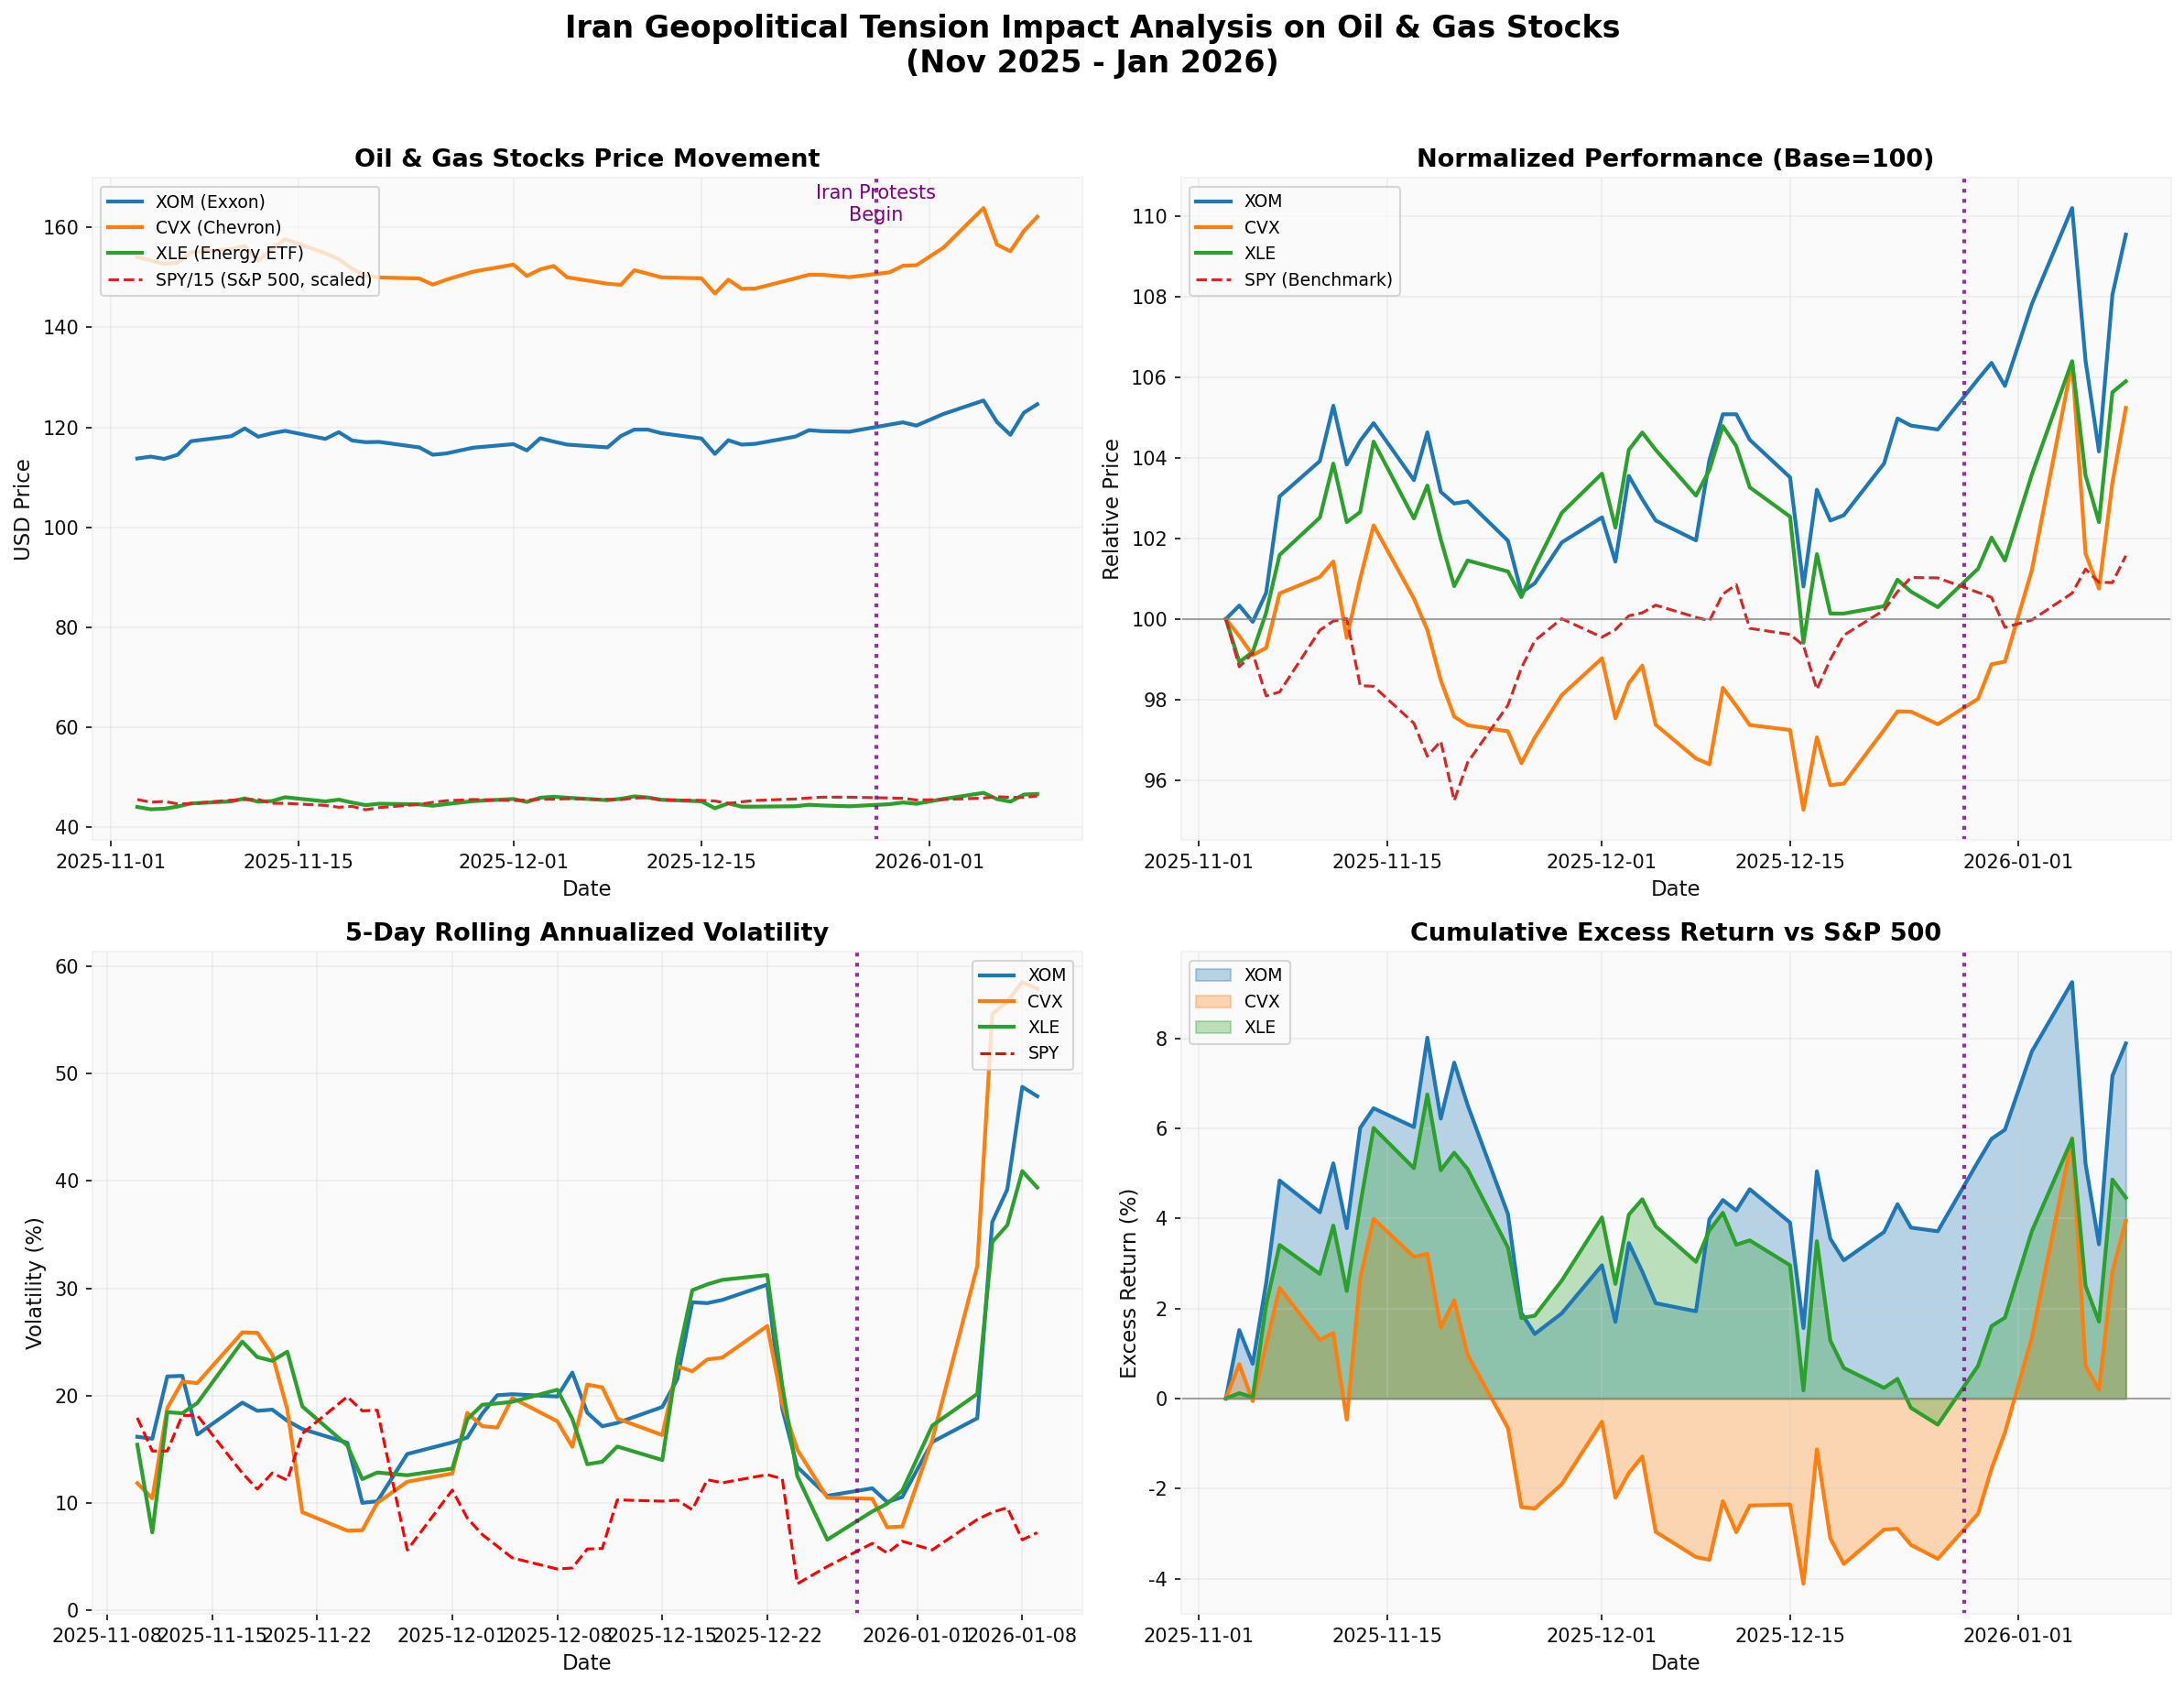
- Price trend: XOM, CVX, and XLE all achieved positive returns from November 2025 to January 2026, and outperformed the S&P 500
- Normalized performance: With 100 as the benchmark, all three oil & gas stocks are significantly higher than the S&P 500
- Volatility analysis: The volatility of energy stocks is approximately 22%, twice that of the S&P 500
- Excess return: Cumulative excess returns were all positive at the end of the analysis period, with XOM having the highest excess return
The impact of Iran’s geopolitical tensions on the global energy market and oil & gas stocks can be summarized as follows:
-
Limited direct impact: The Iranian protests have not yet caused actual disruptions to crude oil production or exports, and the market response has been muted.
-
Structural factors dominate: Global oversupply (approximately 3.8-4.0 million barrels per day expected in 2026) and slowing demand growth are the main factors determining oil prices, and the geopolitical risk premium has declined significantly.
-
Differentiated performance of oil & gas stocks: Major oil & gas stocks (XOM, CVX) outperformed the broader market during the analysis period, but short-term pullback risks remain.
-
Long-term pattern reshaping: The U.S. shale oil revolution and the rise of emerging oil-producing countries have changed the global energy supply pattern, the influence of OPEC+ has relatively declined, and the traditional geopolitical risk premium logic is failing.
-
Investment recommendations: It is recommended that investors focus on fundamental changes rather than short-term event catalysts, maintain a neutral allocation to the energy sector, and prioritize high-quality, financially sound tickers.
[1] Iran in the 2026 Transition Period: An Uprising Caught Between Two Fires
[2] Iran’s Worst Protests in 40 Years Erupt
[3] Amid the Shadow of War and Noose of Sanctions, Iran Seeks a Path Between “Resistance” and “Survival”
[4] Trump’s Enforcement of Oil Sanctions on Iran
[5] December 2025 Iran Tanker Tracking and Year Review
[6] 2025: The Year the Geopolitical Risk Premium Disappeared in the Oil Market
[7] From Venezuela to Iran: Why is the International Crude Oil Market Immune to Geopolitical Conflicts?
[8] Major Oil-Producing Countries Announce Maintenance of Production Levels for February and March
[9] Crude Oil Oversupply May Lead to Lower Price Center
[11] Sector Performance Analysis - Gilin AI Brokerage API Data
[0] Gilin AI Brokerage API Data - Market data, financial analysis, technical indicators
Insights are generated using AI models and historical data for informational purposes only. They do not constitute investment advice or recommendations. Past performance is not indicative of future results.
About us: Ginlix AI is the AI Investment Copilot powered by real data, bridging advanced AI with professional financial databases to provide verifiable, truth-based answers. Please use the chat box below to ask any financial question.