In-Depth Investment Value Analysis Report on Lululemon (LULU)
Unlock More Features
Login to access AI-powered analysis, deep research reports and more advanced features

About us: Ginlix AI is the AI Investment Copilot powered by real data, bridging advanced AI with professional financial databases to provide verifiable, truth-based answers. Please use the chat box below to ask any financial question.
Related Stocks
Based on comprehensive data analysis, I will provide you with an in-depth analysis report on Lululemon’s investment value.
| Metric | Data | Commentary |
|---|---|---|
| Current Share Price | $203.90 | Near 52-week low |
| 52-Week Range | $159.87 - $505.38 | Down 59.7% from peak |
| Market Capitalization | $22.88B | Mid-cap consumer stock |
| P/E (TTM) | 13.88x | Significantly below historical average |
| P/B | 5.09x | Mid-tier within the industry |
| ROE | 39.22% | Excellent return on equity |
| Net Profit Margin | 15.72% | Healthy level |
| DCF Valuation (Mid-point) | $530.94 | Implies 160% upside potential |
| Analyst Consensus | HOLD | Target Price $198 |
- Marc Maurer— Former Co-CEO of On Running (Athleisure Brand Operations Expert)
- Laura Gentile— Former CMO of ESPN (Brand Marketing Expert)
- Eric Hirshberg— Former CEO of Activision (Scalable Growth Expert) [1]
| Wilson’s Position | Management’s Position |
|---|---|
| Focus on the niche high-end “Super Girls” positioning | Mass-market strategy with full-category expansion |
| Emphasize product innovation and community culture | Pursue scale growth and market share |
| Cautious expansion, moat prioritization | Aggressive store expansion, internationalization prioritization |
- Accelerate strategic adjustments or management changes
- Drive cost optimization or asset divestiture
- Enhance shareholder returns (share buybacks, dividends)
- Risk:Short-termism may harm long-term brand building
- Uncertainty in strategic execution
- Talent attrition risk (Americas President Celeste Burgoyne left in November 2025)
- Competitors accelerating market share gains
- Americas segment net revenue declined 2% YoY
- Stagnant same-store sales growth
- Market share eroded by competitors
| Challenge Factor | Specific Performance |
|---|---|
Intensified Competition |
Emerging brands such as Alo Yoga and Vuori are growing rapidly, offering similar products at lower prices |
Weak Consumption |
Amid high inflation, consumers are cutting back on non-essential spending |
Product Innovation Bottleneck |
Lack of breakthrough new products, frequent merchandise execution issues |
Vague Brand Positioning |
Full-category expansion has diluted the professional athleisure brand image |
Price Sensitivity |
Core customer base is sensitive to price increases |
- Vuori:Received investment from Adidas, valued at $4 billion, expanding rapidly with a “daily athleisure” positioning
- Alo Yoga:High-end positioning, strong performance in the yoga niche market, excellent social media marketing
- Mainland China net revenue surged 46%YoY (47% in constant currency)
- Revenue reached $465 million
- Became the second-largest global market after the US
-
Successful Replication of Community-Driven Model
- Lululemon successfully replicated its North American “community yoga” model in China
- Hosted numerous offline events (in-store yoga classes, running clubs)
- Effective collaboration strategy with KOLs and fitness KOLs
-
Accelerated Channel Expansion
- Continued opening stores in prime locations of first- and second-tier cities
- Strong performance in e-commerce channels (Tmall, JD.com, Douyin)
- Mature private domain operation via WeChat Mini Programs
-
Product Localization
- Colors and styles tailored to Chinese consumers’ preferences
- Successful localized products such as winter wear and down jackets
-
Price Positioning
- Pricing in China is higher than local brands but lower than in European markets
- Beneficiary of middle-class consumption upgrade
| Region | Q3 FY25 Revenue | YoY Growth | Strategic Position |
|---|---|---|---|
| US | ~$1.6B | -2% | Core market, facing challenges |
| Mainland China | $465M | +46% |
Growth engine, second-largest market |
| Canada | $321M | -5% | Mature market, moderate decline |
| Other International Markets | $326M | +33% | High-potential market, continuous expansion |
| Metric | Value | Industry Comparison | Commentary |
|---|---|---|---|
| Gross Margin | ~55% | Upper-mid tier in industry | Robust brand premium capability |
| Operating Margin | 22.0% | Excellent | Good operational efficiency |
| Net Profit Margin | 15.72% | Excellent | Strong profitability |
| ROE | 39.22% | Exceptional | Excellent shareholder returns |
- Q3 FY2025 revenue reached $2.57B, up 7% YoY, exceeding market expectations [6]
- EPS of $2.59, beating analyst expectations by 16.7%
- However, net profit declined 12.8% YoY, mainly affected by rising costs and increased marketing investment
- Operating cash flow remains positive
- Free cash flow (latest quarter) was approximately $151 million
- Cumulative share buybacks over the past 10 years exceed $5.5 billion
- Debt Risk Rating: Low Risk
- Current Ratio: 1.51
- Quick Ratio: 0.59 (high inventory proportion)
| Metric | LULU | Industry Average | Discount/Premium |
|---|---|---|---|
| P/E | 13.88x | 22.5x | 38% Discount |
| P/B | 5.09x | 4.2x | 21% Premium |
| P/S | 2.07x | 1.8x | 15% Premium |
| Scenario | Valuation | Upside from Current Price | Key Assumptions |
|---|---|---|---|
| Conservative | $432.12 | +112% | Zero growth, 24.5% EBITDA margin |
| Base Case | $530.94 | +160% |
24.5% revenue CAGR, 25.7% margin |
| Optimistic | $772.30 | +279% | 27.5% revenue growth, 27% margin |
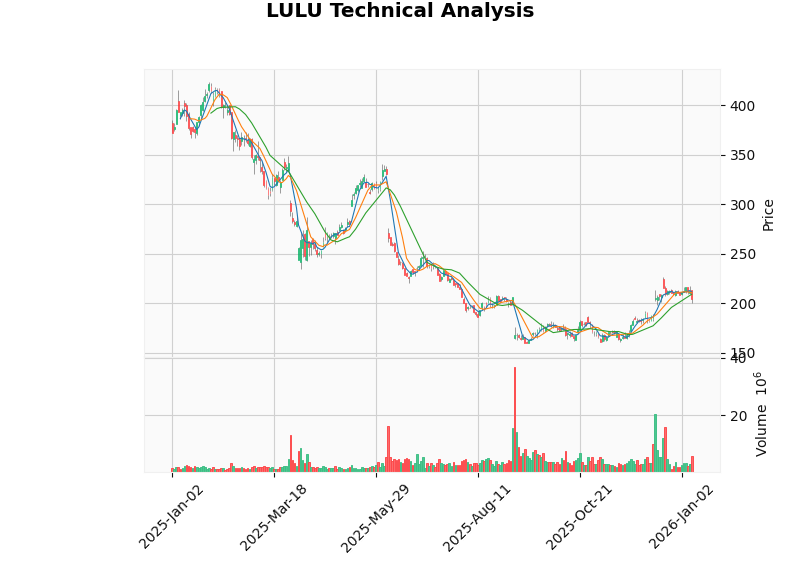
- Resistance Levels: $208.99 (20-day moving average), $225.98 (recent high)
- Support Levels: $200.35, $160.46 (52-week low)
| Indicator | Value | Signal Interpretation |
|---|---|---|
| RSI (14) | 42.8 | Neutral to weak, not oversold |
| MACD | No Crossover | Neutral |
| KDJ | K:42.8, D:48.8 | Weak |
| 20-Day Moving Average | $208.99 | Share price below moving average |
| 50-Day Moving Average | $187.55 | Share price above moving average |
| Beta | 1.02 | Moves in sync with the market |
- Short-Term:No clear buy/sell signals
- Medium-Term:Monitor breakout direction in the $200-$210 range
- Long-Term:Share price above 200-day moving average, long-term trend neutral to bullish
-
Attractive Valuation
- P/E of 13.88x is at a historical low
- Over 100% discount to DCF intrinsic value
- Market has fully priced in short-term difficulties
-
China Growth Engine
- 46% revenue growth, significant room for penetration improvement
- Expected to become one of the largest global markets
-
Brand Moat
- Lululemon still has strong brand power in the high-end athleisure segment
- Maintains leadership in product innovation and fabric technology
- Community culture is difficult to replicate quickly
-
Shareholder Return Potential
- Activist investors may push for share buybacks or dividends
- Management changes may bring strategic optimization
-
North American Market Dilemma
- Alo Yoga and Vuori continue to erode market share
- Uncertainty in consumption environment
-
Management Transition Period
- New CEO candidate and strategic direction are unclear
- Execution risk increases
-
Uncertainty of Wilson’s Proxy Fight
- Proxy fight may distract management
- Strategic disputes may lead to operational chaos
-
Tariffs and Supply Chain
- Potential tariff policy risks
- Dependence on Vietnam/China supply chains
| Scenario | Probability | 12-Month Target Price | Upside/Downside |
|---|---|---|---|
Optimistic |
25% | $350 | +72% |
Base Case |
50% | $250 | +23% |
Pessimistic |
25% | $160 | -21% |
-
Valuation:The current 13.88x P/E represents a discount of over 50% compared to the historical average (~30x), with the market having fully priced in difficulties. DCF valuation indicates 160% upside potential.
-
Catalysts:
- New CEO appointment (Q1 2026)
- Continued outperformance of China segment
- Resolution of Wilson’s proxy fight
- Signs of stabilization in North American segment
-
Risk Hedging:
- Set stop-loss at $175 (~14% below current price)
- Monitor Q4 FY2025 earnings report (March 26, 2026)
-
Positioning Recommendations:
- Suitable for 10-15% allocation in core portfolios
- Stagger position building, avoid heavy single-position entry
- Accumulation window: when share price falls below $180
| Risk Type | Risk Description | Impact Level | Response Strategy |
|---|---|---|---|
Strategic Risk |
Strategic swings caused by disputes between Wilson and management | High | Monitor proxy fight outcome |
Competitive Risk |
Continuous market share gains by Alo Yoga and Vuori | High | Track market share |
Execution Risk |
Operational pressure during new CEO transition | Medium | Monitor earnings guidance |
Macroeconomic Risk |
Sustained weak consumption in the US | Medium | Monitor economic data |
Policy Risk |
Tariff and supply chain disruptions | Low | Diversify sourcing |
In the short term, the founder’s involvement is more of a
Lululemon is at a critical
- Valuation Bottom:Current share price has fallen to a 5-year low, with attractive valuation
- Diversified Growth:The 46% growth in the China market contrasts sharply with the decline in North America, validating the brand’s global potential
- Transformation Window:Dual pressure from activist investors and the founder may accelerate management adjustments and strategic optimization
[1] SGI Europe - “Lululemon founder launches proxy fight to reshape board” (https://www.sgieurope.com/corporate/lululemon-founder-launches-proxy-fight-to-reshape-board/118791.article)
[2] Seeking Alpha - “Lululemon founder initiates proxy fight with board nominees” (https://seekingalpha.com/news/4535669-lululemon-founder-initiates-proxy-fight-with-board-nominees)
[3] CNBC - “Activist Elliott shakes up leadership at Lululemon. How the firm can help reinvigorate the athleisure giant” (https://www.cnbc.com/2026/01/10/how-activist-elliott-can-help-reinvigorate-athleisure-giant-lululemon.html)
[4] SEC Filing 8-K - “Separation Agreement and Release” (https://www.sec.gov/Archives/edgar/data/1397187/000139718725000054/lulu-20251203.htm)
[5] Yahoo Finance - “Can lululemon’s ‘Power of Three x2’ Strategy Still Hit FY26 Targets” (https://finance.yahoo.com/news/lululemons-power-three-x2-strategy-170200644.html)
[6] Company Overview - LULU Q3 FY2025 Earnings Data [0]
Insights are generated using AI models and historical data for informational purposes only. They do not constitute investment advice or recommendations. Past performance is not indicative of future results.
About us: Ginlix AI is the AI Investment Copilot powered by real data, bridging advanced AI with professional financial databases to provide verifiable, truth-based answers. Please use the chat box below to ask any financial question.