Analysis of the Reasons for the Divergence Between Revenue and Sales Volume Growth Rates of Xiantan Co., Ltd.
Unlock More Features
Login to access AI-powered analysis, deep research reports and more advanced features
About us: Ginlix AI is the AI Investment Copilot powered by real data, bridging advanced AI with professional financial databases to provide verifiable, truth-based answers. Please use the chat box below to ask any financial question.
Related Stocks
Based on collected data and in-depth analysis, I will provide a complete analysis of the reasons for the divergence between the revenue growth rate and sales volume growth rate of Xiantan Co., Ltd.'s chicken products.
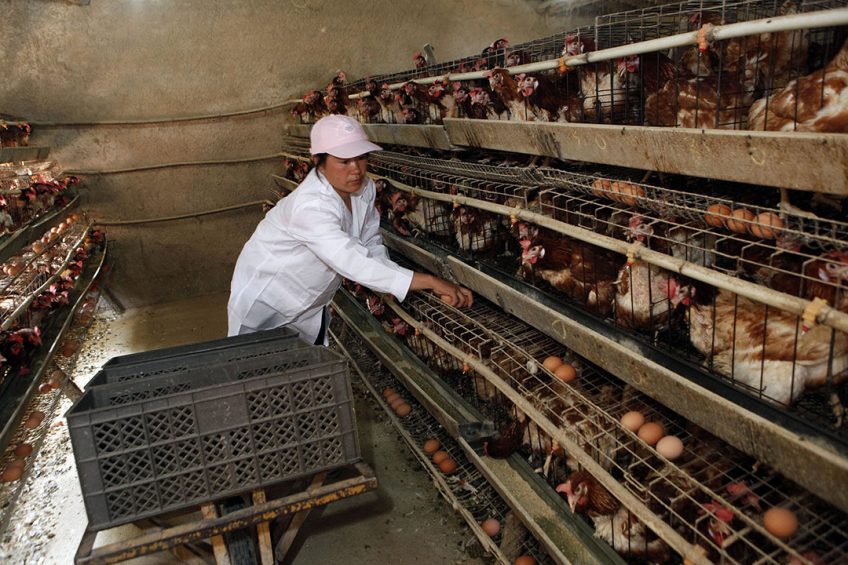
According to the latest announcement, in December 2025, Xiantan Co., Ltd.'s chicken product sales revenue reached RMB 529 million, a year-on-year increase of 9.41%, while sales volume stood at 55,100 tons, a year-on-year increase of 6.76%. The revenue growth rate outpaced the sales volume growth rate by approximately
The most core reason lies in the significant optimization of the company’s product structure. This can be seen from the first half of 2025 data:
| Product Category | Revenue Growth Rate | Gross Margin | Change in Gross Margin |
|---|---|---|---|
| Chicken Products | 5.69% | 7.80% | +7.23pct |
| Conditioned Products (Pre-made Dishes) | 16.44% | 0.68% | -8.75pct |
Notably, the performance of the
The second important factor for the revenue growth rate outpacing the sales volume growth rate is the
- Brand Premium Capability: The company’s products have obtained multiple international certifications including ISO9001, HACCP, FSSC22000, and BRCGS[3]
- Customer Structure Optimization: Direct sales revenue increased by 5.27% year-on-year, while distribution sales revenue increased by 9.65% year-on-year[4]
- Channel Expansion: The number of distributors increased from 1,288 in the first half of 2024 to 1,359 in the first half of 2025, representing a 5.51% increase[4]
In the first half of 2025, the main business cost of the company’s chicken products decreased by 1.99% year-on-year, while revenue increased by 5.69%. This “cost reduction and efficiency improvement” situation directly drove a significant improvement in gross margin[4]. This is mainly due to:
- Decline in feed raw material prices (domestic feed raw material prices fell significantly in 2024)
- Gradual release of production capacity from the Zhucheng project, bringing scale effects into play
- Refined operation and management under the “steady and gradual progress” strategy
According to institutional forecasts, Xiantan Co., Ltd.'s net profit in 2025 is expected to reach
| Financial Indicator | 2024 Actual | 2025E | Year-on-Year Change |
|---|---|---|---|
| Operating Revenue (RMB 100 million) | 52.91 | 58-60 | +10-13% |
| Net Profit (RMB 100 million) | 2.06 | 2.81 | +37.5% |
| Gross Margin | ~6% | ~7.5% | +1.5pct |
The improvement of gross margin is the key to profitability enhancement. From a trend perspective, the gross margin of the company’s chicken products has continued to recover from the low level in 2024, reaching 7.80% in the first half of 2025, an increase of
- Cost Side: The downward trend of feed costs is expected to continue
- Revenue Side: Product structure optimization drives the increase in average price
- Scale Effects: The release of production capacity from the Zhucheng project dilutes fixed costs
In 2024, the Zhucheng project achieved a commercial broiler slaughter volume of
The company’s financial situation remains stable:
- Current Ratio: 1.83, indicating good short-term solvency
- Quick Ratio: 1.54, indicating strong liquidity
- ROE: 6.24%, indicating stable asset utilization efficiency[7]
More importantly, the company attaches great importance to shareholder returns. In 2024, the cumulative cash dividend reached
| Valuation Indicator | Value | Industry Comparison |
|---|---|---|
| PE (TTM) | 18.33x | Below industry average |
| PB | 1.16x | At historical low |
| EV/OCF | 6.10x | Relatively reasonable |
The company’s current PE and PB ratios are both at historical lows. According to industry research reports, the valuation of the white-feather broiler sector has fallen below the
- Certainty of Performance Growth: The expected 37.5% net profit growth is at a relatively high level in the industry
- Product Structure Upgrade: The rapid growth of the pre-made dishes business is expected to raise the company’s valuation center
- Heavy Holdings by Social Security Fund: At the end of the third quarter, 2 pension fund portfolios appeared in the company’s top 10 tradable shareholders, and Social Security Fund Portfolio 413 also held a heavy position in the stock[6]
- Sector Valuation Recovery: Since the end of September, affected by domestic macro stimulus policies, the white-feather broiler sector has risen in resonance with the broader market[8]
- Risk of chicken price fluctuations
- Changes in raw material costs
- Intensified competition due to industry capacity expansion
From the perspective of institutional attitudes, the company has attracted attention from multiple funds and securities firms. Institutions such as Western Lead Fund, Defu Capital, Zhongtai Securities, and Huafu Securities conducted on-site research on the company in May 2025, and gave positive evaluations of the company’s “steady and gradual progress” development strategy and full industrial chain layout[3].
-
The fundamental reason for the revenue growth rate outpacing the sales volume growth rateis product structure optimization (increased proportion of high-margin conditioned products) and rising average prices, rather than simple chicken price increases. This reflects the effectiveness of the company’s strategic transformation.
-
The 2025 profitability outlook is optimistic, with net profit expected to grow by 37.5% and gross margin expected to further rise to over 7.5%. The release of production capacity from the Zhucheng project and the rapid growth of the pre-made dishes business are the main drivers.
-
There is room for valuation recovery, with the current PE ratio of 18.33x and PB ratio of 1.16x at historical lows. Supported by the dual pillars of performance growth certainty and product structure upgrade, the valuation center is expected to move upward.
- Risk of price fluctuations of white-feather broilers
- Rebound in raw material costs (feed prices)
- Market demand falling short of expectations
- Risk of overcapacity in the industry
[1] Eastmoney - Xiantan Co., Ltd. December 2025 Operating Data
[3] iFinD - Xiantan Co., Ltd. Investor Relations Activity Record
[4] Shandong Xiantan Co., Ltd. 2025 Semi-Annual Report
[5] iFinD F10 - Xiantan Co., Ltd. Profit Forecast
[7] Jinling API - Xiantan Co., Ltd. Company Profile and Financial Data
[8] Eastmoney - White-Feather Broiler Industry Investment Framework (Guosen Securities)
Report Generation Date: January 11, 2026
Insights are generated using AI models and historical data for informational purposes only. They do not constitute investment advice or recommendations. Past performance is not indicative of future results.
About us: Ginlix AI is the AI Investment Copilot powered by real data, bridging advanced AI with professional financial databases to provide verifiable, truth-based answers. Please use the chat box below to ask any financial question.