Analysis of the Impact of the Federal Reserve's Pause in Interest Rate Cut Cycle on US Stock Valuations and Asset Allocation Strategies
Unlock More Features
Login to access AI-powered analysis, deep research reports and more advanced features

About us: Ginlix AI is the AI Investment Copilot powered by real data, bridging advanced AI with professional financial databases to provide verifiable, truth-based answers. Please use the chat box below to ask any financial question.
Related Stocks
Based on the latest market data and research report information, I will systematically analyze
The Federal Reserve has cut interest rates three consecutive times by December 2025, lowering the federal funds rate by 25 basis points to the
| Key Indicators | Current Value | Market Expectations |
|---|---|---|
| Probability of January Rate Cut | only 5% |
Almost certain to pause |
| Timing of First 2026 Rate Cut | June or September |
Delayed compared to previous expectations |
| December Unemployment Rate | 4.4% (fell more than expected) | Expected to fall to 4.5% |
| Nonfarm Payrolls | Expected 70,000-75,000 | Rebound from 64,000 in November |
Minutes of the FOMC meeting show that policymakers have
- Majority: Support continued rate cuts to address downside risks to employment
- Minority: Tend to keep rates unchanged to assess lagged effects of policies
Federal Reserve Governor
As of January 10, 2026, major US stock indices have shown a
| Index | Past 30-Day Performance | YTD 2025 | Valuation Characteristics |
|---|---|---|---|
S&P 500 (SPY) |
+2.54% | +19.57% | Current price is at the 97.2th percentile of the past 3-month range |
Nasdaq |
+2.19% | - | Led by tech stocks |
Dow Jones Industrial Average |
+4.89% |
- | Strong performance from traditional blue chips |
Russell 2000 |
+6.42% |
- | Best performance from small-cap stocks |
| Stock | Market Capitalization (USD Trillion) | P/E (TTM) | 52-Week Price Change | Valuation Assessment |
|---|---|---|---|---|
Alphabet (GOOGL) |
3.97 | 32.40 | Hit 52-week high | Elevated valuation |
Apple (AAPL) |
3.83 | 34.72 | +46.5% | Reasonably elevated valuation |
Microsoft (MSFT) |
3.56 | 34.09 | +31.2% | Moderate valuation |
NVIDIA (NVDA) |
4.50 | 45.87 | +85.3% | Elevated valuation |
Based on technical analysis of the S&P 500 ETF (SPY):
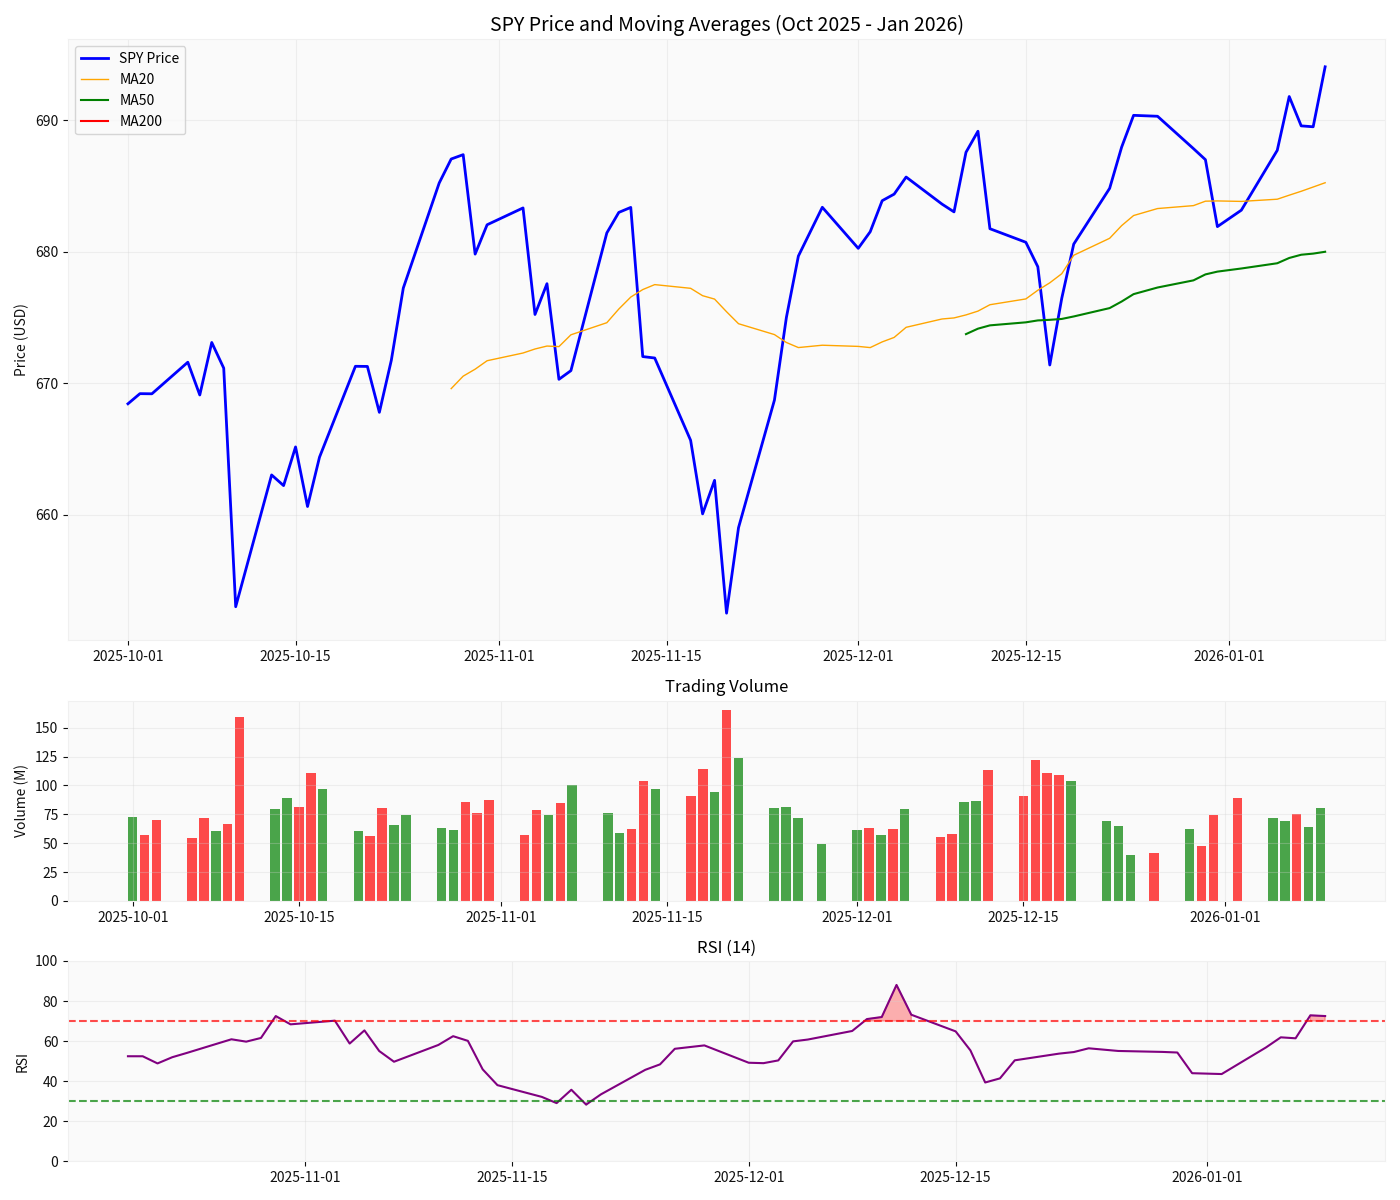
- RSI(14) = 72.49: Has entered theoverbought zone, posing short-term pullback risks
- MACD Indicator: Bullish signal, but momentum has weakened somewhat
- Stock Price Position: Above the 20-day moving average (+1.29%) and 50-day moving average (+2.07%), showing abullish alignment
- Price Range Position: At the97.2th percentileof the past 3-month high, close to the upper bound of the range
- Increased Expectations of Economic Soft Landing: The labor market remains resilient (low hiring, low layoffs), and the unemployment rate unexpectedly fell to 4.4%, indicating the economy has not entered a recession[1][2]
- Reduced Policy Uncertainty: Pausing rate cuts means monetary policy enters a stable period, reducing market volatility
- Stable Capital Costs: Improved predictability of corporate financing conditions
- Weakened Valuation Support: During a rate cut cycle, falling interest rates boost intrinsic stock value via the DCF model; pausing rate cuts will weaken this support
- Pressure to Adjust Earnings Expectations: If economic growth slows, corporate earnings growth may fall short of expectations
- Marginal Tightening of Liquidity: Pausing rate cuts means easing will not be further expanded
- Real Estate(+1.36% intraday gain): Pausing rate cuts may delay its valuation recovery[5]
- Industrials(+1.32%): Supported by expectations of economic resilience
- Consumer Staples(+1.13%): Defensive attributes stand out
- Energy(-1.59%): Demand outlook impacted by expectations of economic slowdown
- Financials(-1.01%): Interest rate-sensitive sector
- Healthcare(-0.64%): Valuations returning to rational levels
Based on the macro environment of
| Strategy Dimension | Recommendation | Rationale |
|---|---|---|
Overall Positioning |
Maintain neutral-to-cautious positioning | Valuations are at high levels, RSI is overbought |
Sector Allocation |
Balance defensive and growth sectors | Balance valuation and growth |
Style Preference |
Value over growth | Expectations of rate cuts have weakened |
Geographic Allocation |
US stocks as core, moderate diversification | US stocks have the best liquidity |
-
Healthcare(Allocation opportunity after valuation correction)
- Sub-sectors: Innovative drugs, medical devices
- Rationale: Defensive attributes + reasonable valuations + high earnings certainty
-
Consumer Staples
- Sub-sectors: Food & beverage, household goods
- Rationale: Inelastic demand during economic slowdown
-
High-Quality Tech Leaders
- Targets: Apple, Microsoft, Alphabet
- Rationale: Relatively reasonable valuations (30-35x PE), strong earnings growth certainty
-
High-Valued Growth Stocks(especially AI-themed stocks)
- Risk: High interest rate sensitivity, significant valuation pullback pressure
-
Energy Stocks
- Risk: Demand impacted by expectations of global economic slowdown
-
Small-Cap Stocks(Russell 2000)
- Risk: Elevated valuations + higher interest rate sensitivity
- 40% S&P 500 index fund
- 25% High-quality tech leaders (Apple, Microsoft)
- 20% Healthcare ETF
- 15% Bonds/cash
- 35% S&P 500 index fund
- 25% Growth tech stocks (AI, semiconductors)
- 20% Industrials/consumer discretionary
- 20% Bonds/gold
| Risk Type | Details | Response Strategy |
|---|---|---|
Policy Risk |
Policy orientation of the new Federal Reserve Chair | Monitor nomination confirmation and congressional testimony in January-February |
Economic Risk |
Unexpected deterioration of the labor market | Monitor weekly initial jobless claims |
Inflation Risk |
Core PCE rises above 3% | Rate cut expectations may be further delayed |
Valuation Risk |
S&P 500 is at historical highs | Control positions, reduce holdings on rallies |
- January nonfarm payrolls data (released January 10)
- January FOMC meeting minutes
- Core PCE Price Index
- Progress of Federal Reserve Chair appointment
- Corporate Q1 earnings performance
- Structural changes in the labor market
-
Pause in rate cut cycle is a foregone conclusion: The probability of a rate cut in January is only 5%, and the first rate cut in 2026 may be delayed to June or September
-
US stock valuations are under pressure: Current prices are at the 97th percentile of the past 3-month range, RSI is overbought, posing short-term pullback risks
-
Allocation strategy shifts to defense: Recommend shifting from high-valued growth stocks to high-quality value stocks and defensive sectors
-
Focus on catalyst events: Appointment of new Federal Reserve Chair, nonfarm payrolls data, corporate earnings performance
[1] Wall Street CN - “It’s Nonfarm Payrolls Night Again! Employment May ‘Mildly Rebound’, Is a January Rate Cut Still Possible?” (https://wallstreetcn.com/articles/3762947)
[2] FastBull - “Nonfarm Payrolls Night Exam: Is the Fed’s January Rate Cut in Jeopardy?” (https://m.fastbull.com/cn/news-detail/4364562_1)
[3] East Money - “150 Basis Points of Fed Rate Cuts? Milan’s Comments Ignite the Stock Market” (http://caifuhao.eastmoney.com/news/20260108232200034276910)
[4] Jinling AI - Market Data and API Analysis
[5] Jinling AI - Industry Performance Analysis
Insights are generated using AI models and historical data for informational purposes only. They do not constitute investment advice or recommendations. Past performance is not indicative of future results.
About us: Ginlix AI is the AI Investment Copilot powered by real data, bridging advanced AI with professional financial databases to provide verifiable, truth-based answers. Please use the chat box below to ask any financial question.