Operational Characteristics of Main Force Capital in the A-Share Market and Evaluation of the Effectiveness of Retail Investor Follow-Up Strategies
Unlock More Features
Login to access AI-powered analysis, deep research reports and more advanced features

About us: Ginlix AI is the AI Investment Copilot powered by real data, bridging advanced AI with professional financial databases to provide verifiable, truth-based answers. Please use the chat box below to ask any financial question.
Related Stocks
Based on the latest research data and market empirical analysis, I will systematically evaluate the operational characteristics of main force capital in the A-Share market and the effectiveness of retail investor follow-up strategies for you.
In the context of the A-Share market, “main force capital” typically refers to market participants with large capital scales that have a significant impact on short-term stock price movements, mainly including the following categories [0][1]:
| Main Force Capital Type | Representative Characteristics | Investment Style | 2025 Dragon and Tiger List Share |
|---|---|---|---|
Institutional Special Seats |
Public funds, private funds, insurance funds, etc. | Value investment, long-term holding | 20.57% |
Stock Connect (Foreign Capital) |
Northbound capital, overseas institutional investors | Focus on fundamentals, allocation-oriented | 22.94% |
Hot Money / Brokerage Departments |
Well-known hot money, short-term capital | Theme speculation, trend following | 35.49% |
- Dragon and Tiger List Data: The top five brokerage departments for buying and selling abnormally volatile stocks published daily by the exchange
- Capital Flow Indicators: Large order net inflow/outflow amount and proportion
- Position Changes: Quarterly position disclosures by institutional investors
Research based on 2025 Dragon and Tiger List data reveals the key operational rules of main force capital [1][2]:
- Institutional seats have broken the trillion-yuan markin Dragon and Tiger List turnover for the first time in history (reaching 1.14 trillion yuan), accounting for 20.57% of total Dragon and Tiger List turnover [1]
- Stock Connect capital also exceeded the trillion-yuan mark, surpassing 1.27 trillion yuan, accounting for 22.94% [1]
- Institutional heavyweight stocks are highly concentrated in High-Boom Tracks, especially leading AI stocks with realized performance (Tianfu Communication, Xinyisheng, Demingli, Dongshan Precision, etc.) [1]
- Hot money focuses on Theme Speculation, and actively traded stocks on the Dragon and Tiger List generally have mediocre performance (Talkweb Information, Hengbao Co., Ltd., Snowman Group, etc.) [1]
According to the academic research Main Force Capital Anomalies and Investor Information Game, the operations of main force capital exhibit the following characteristics [3]:
| Operation Phase | Behavioral Characteristics | Difficulty for Retail Investors to Respond |
|---|---|---|
Position Building Phase |
Hidden accumulation, batch buying | Difficult to identify |
Shakeout Phase |
Shock consolidation, washing out floating chips | Easy to be washed out |
Pull-up Phase |
Rapid pull-up, breaking new highs | Risk of chasing highs |
Distribution Phase |
High-volume at high prices, shock distribution | Risk of taking over |
According to the data of the
| Time Horizon | Number of Brokerage Departments with Win Rate >50% After Net Buying | Proportion |
|---|---|---|
| Next Trading Day | 24 | 24% |
| 5 Trading Days | 3 | 3% |
| 120 Trading Days | 11 | 11% |
The same data source shows [1][2]:
| Time Horizon | Number of Brokerage Departments with Win Rate >50% After Net Selling | Proportion |
|---|---|---|
| Next Trading Day | 95 |
95% |
| 5 Trading Days | 98 |
98% |
| 120 Trading Days | 92 |
92% |
The performance of some high-profile top hot money is as follows [1][2]:
| Hot Money / Seat | Turnover Scale | Short-Term Win Rate | Medium-to-Long-Term Performance |
|---|---|---|---|
| Chen Xiaoqun (Galaxy Securities Dalian Huanghe Road) | 32 billion yuan | Next-day win rate 57% | Average 13% loss in 60 days |
| Zhang Mengzhu (Guotai Haitong Securities Jiangsu Road) | High | Next-day win rate >50% | Continued weakness |
| Chaogu Yangjia (Huaxin Securities Ruby Road) | Medium | Next-day win rate 70% |
Later period win rate <50% |
| Sun Yu (CITIC Securities Shanghai Liyang Road) | High | <50% | Limited sustainability |
Based on the above data analysis, I have constructed the following effectiveness evaluation matrix:
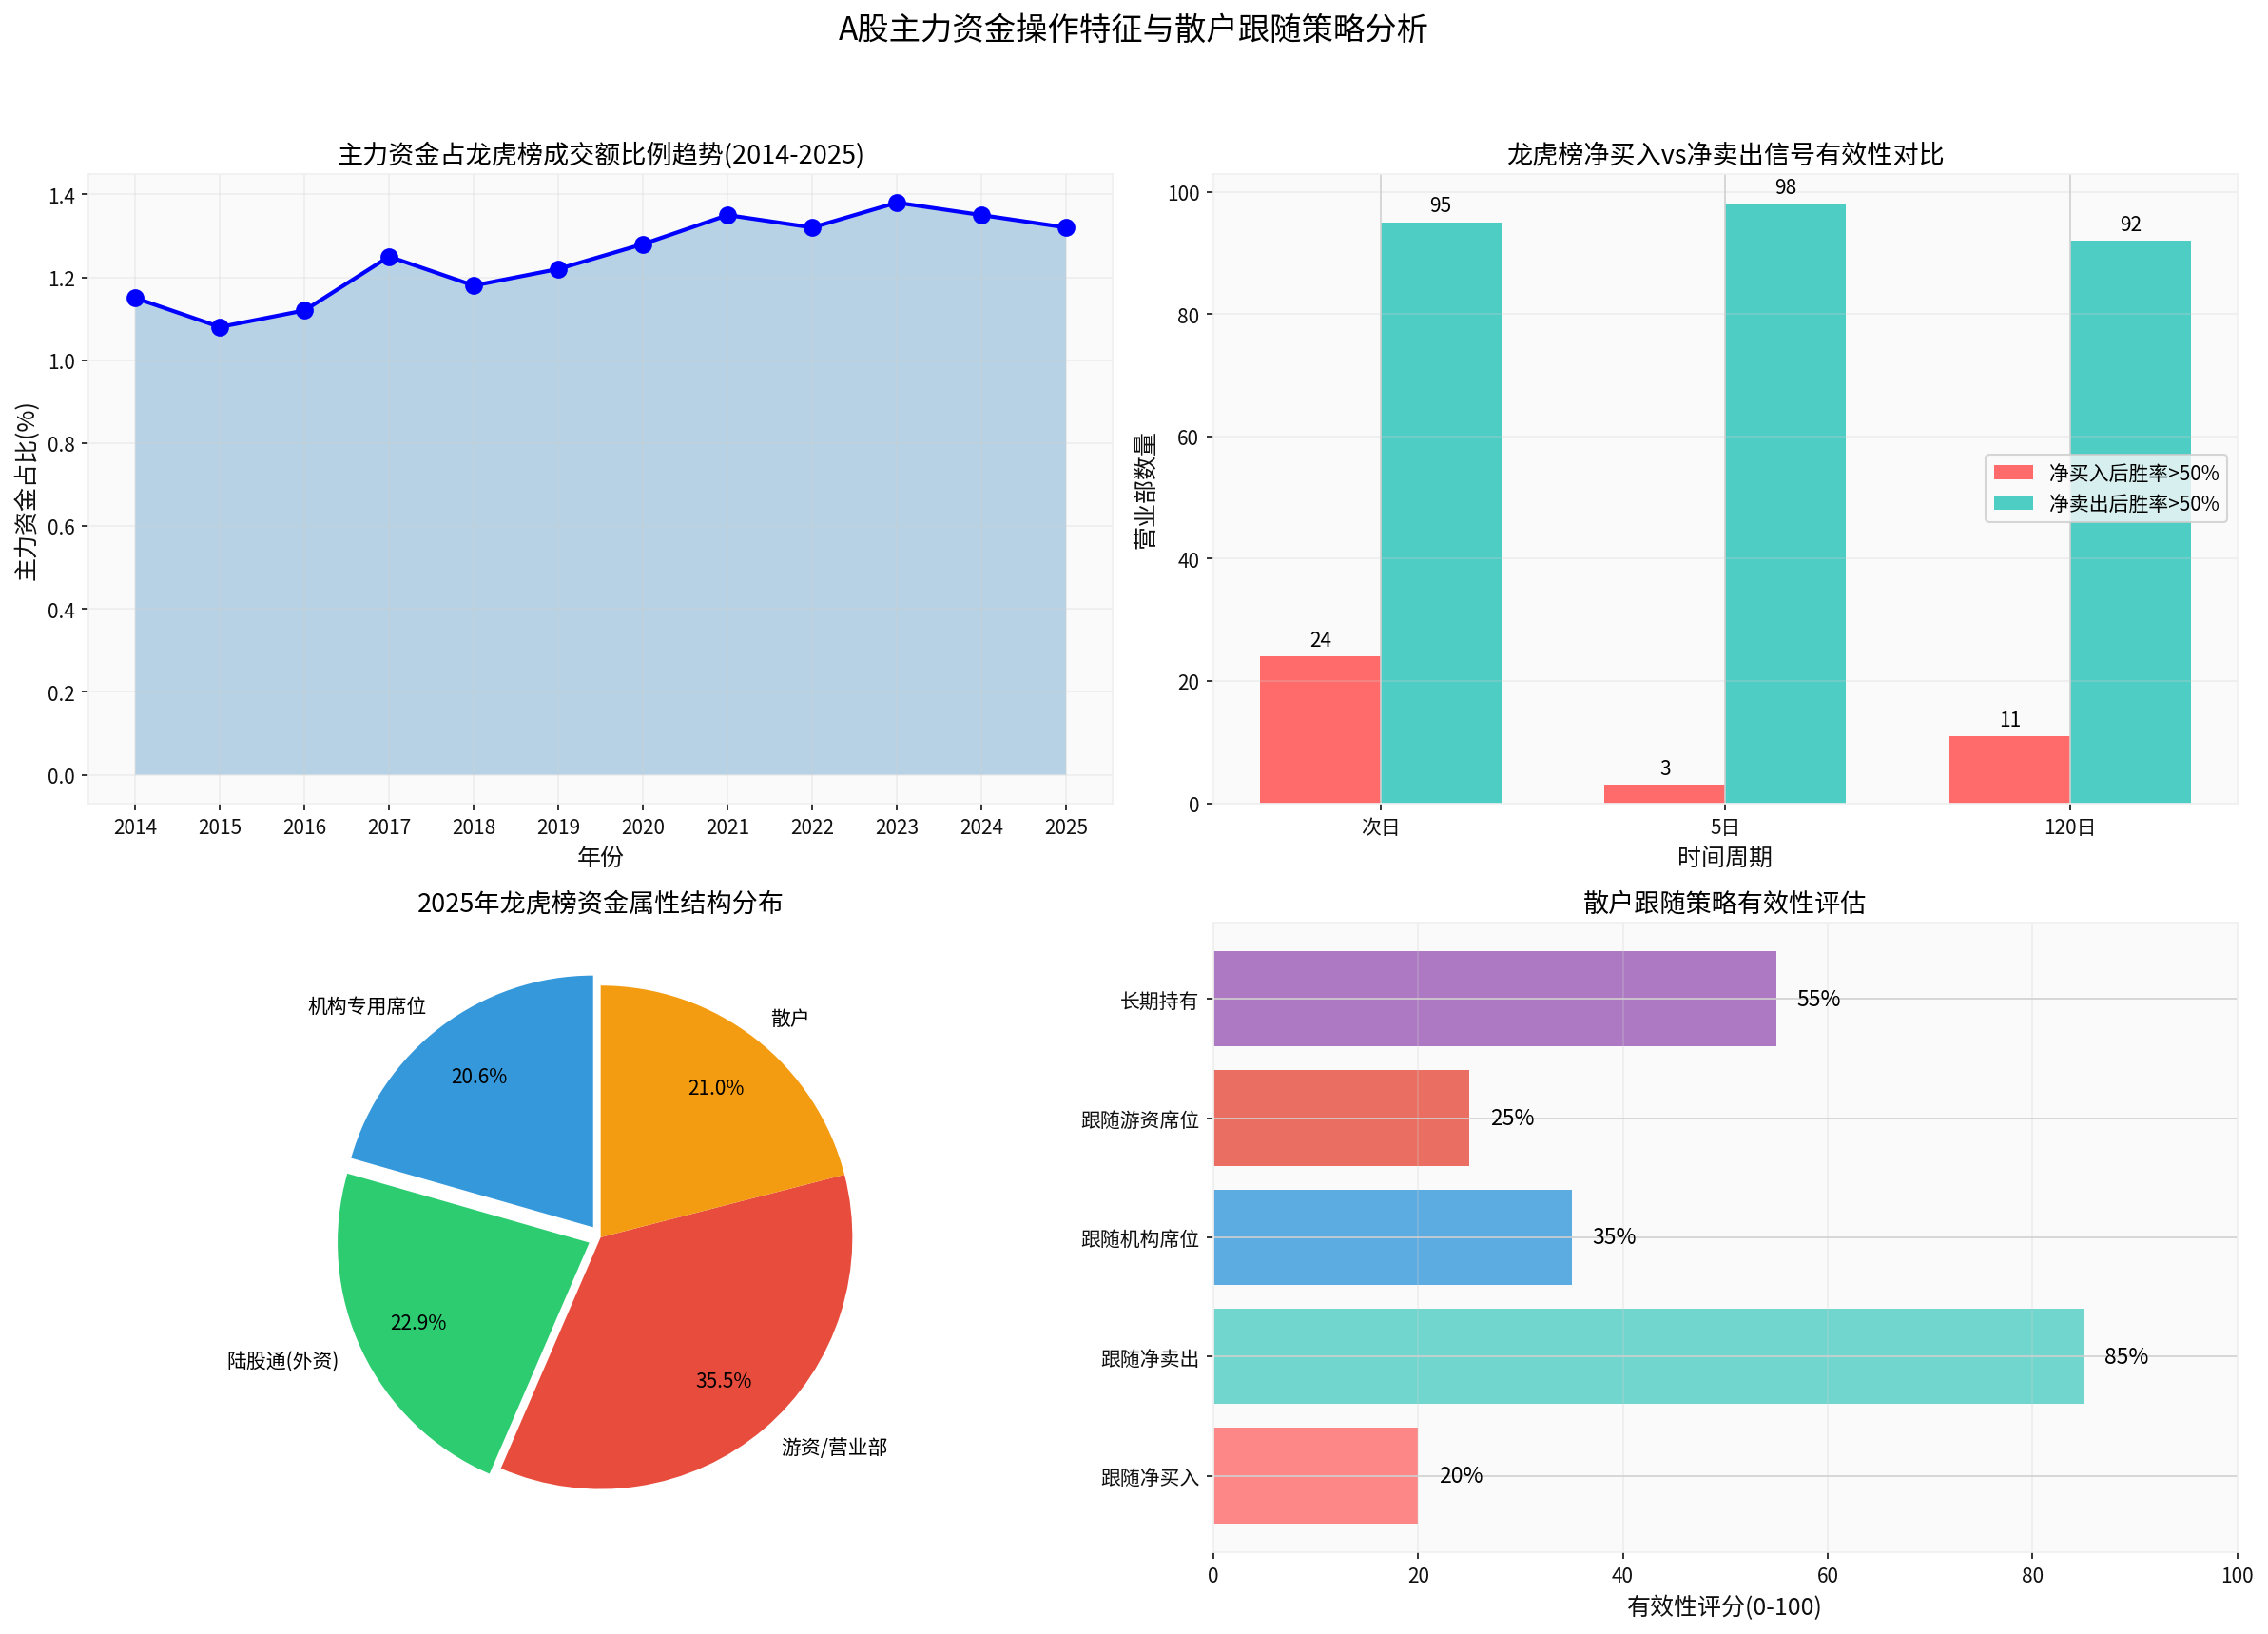
| Follow-Up Strategy | Effectiveness Rating | Risk Level | Recommendation Level |
|---|---|---|---|
Follow Net Selling Signals |
85% | Low | ★★★★★ |
| Long-Term Holding of Index Funds | 55% | Low | ★★★★☆ |
| Follow Institutional Seat Buying | 35% | Medium | ★★★☆☆ |
| Follow Hot Money Seat Buying | 25% | High | ★★☆☆☆ |
Follow Net Buying Signals |
20% | Very High | ★☆☆☆☆ |
According to academic research, the factors affecting the predictive ability of main force capital signals include [3]:
- Number of Retail Participants: The higher the retail participation in a stock, the stronger the predictive ability of main force capital
- Market Capitalization Level: The follow-up effect is more significant for small and medium-cap stocks
- Institutional Shareholding Ratio: The institutional shareholding ratio is positively correlated with signal effectiveness
- Information Environment: The higher the degree of information asymmetry, the greater the value of follow-up strategies
- The public release time of Dragon and Tiger List data lags behind the actual trading time
- By the time retail investors obtain the information, main force capital may have already completed its operations
- Main force capital may deliberately create “false breakouts” to lure long positions or “false breakdowns” to lure short positions
- Net buying signals often become a “smokescreen” for main force capital to distribute shares
- The effectiveness of follow-up strategies is higher in a bull market
- The signal distortion rate rises significantly in volatile markets and bear markets
The article Main Force Capital Anomalies and Investor Information Game provides an important theoretical framework [3]:
“The behavior of retail investors following main force capital is the result of rational game between different investors under information asymmetry. Institutional investors attract retail investors to take over by releasing large order signals; retail investors choose to follow large order signals for investment to reduce information costs. The result of the game leads to a positive correlation between the net inflow rate of main force capital and future stock returns.”
Academic research points out that the concept of “transaction surplus” is crucial to understanding this mechanism [3]:
- When retail participation is high, institutions can expect sufficient subsequent demand to support their positions
- Retail investors reduce information costs by following signals
- When large orders convey stronger information content, the transaction surplus is particularly substantial
Academic research puts forward the following recommendations to reduce irrational chasing by retail investors [3]:
- Build a standardized and transparent capital market
- Develop index investing
- Reduce the information disadvantage of retail investors
- Promote the further development and growth of institutional investors
| Strategy Recommendation | Specific Operations | Expected Effect |
|---|---|---|
Prioritize Net Selling Signals |
When institutions/Stock Connect have large net sales, decisively reduce positions | Avoid downside risks |
| Treat Net Buying Signals Cautiously | Avoid blindly chasing highs, combine with fundamental analysis | Reduce the risk of taking over shares |
| Extend Holding Period | Targets with institutional involvement are suitable for long-term holding | Capture value regression |
| Control Positions and Set Stop-Loss | Set strict stop-loss discipline | Limit the magnitude of losses |
- Information Lag Risk: There is a time lag in the release of Dragon and Tiger List data, which may cause missing the optimal operation timing
- Risk of Main Force Reverse Operation: Main force capital may use the follow-up behavior of retail investors to conduct reverse operations
- Market Environment Risk: The effectiveness of signals may drop significantly in extreme market conditions
- Stock-Specific Risk: The fluctuation of a single stock may deviate from the overall pattern
Given the deepening institutionalization of the A-Share market, institutional investors with professional research and investment research capabilities are occupying a dominant position, and a rational pricing mechanism is gradually being established [1]. For ordinary investors:
- Index investing may be a better choice
- Over-reliance on seat effects for follow-up operations is difficult to achieve ideal results
- Establishing a scientific investment system and risk control mechanism is crucial
Based on the latest 2025 data and market research, the effectiveness of main force capital operations and retail investor follow-up strategies in the A-Share market can be summarized as follows:
- Net selling signals are far more referenceable than net buying signals(win rate comparison: 95% vs 24%)
- Top hot money has acceptable short-term win rates but poor medium-to-long-term sustainability(average loss of 13% in 60 days)
- Retail investor follow-up strategies are rational game behaviors but have significant limitations
- Institutional dominance continues to strengthen, and market effectiveness is gradually improving
- For ordinary investors, index investing and value investment may be better strategies
[0] Data Tool API - Jinling AI Financial Database
[1] Securities Times - “In-Depth Analysis of Dragon and Tiger List Data! What is the Win Rate of Top Hot Money Like Chen Xiaoqun?” (https://www.stcn.com/article/detail/3573512.html)
[2] Sina Finance - “In-Depth Analysis of Dragon and Tiger List Data” (https://finance.sina.com.cn/stock/zqgd/2026-01-06/doc-inhfives6053663.shtml)
[3] Kang Qi, Gao Feng, Liu Shuo, Wang Qian, Ye Ziwen - “Main Force Capital Anomalies and Investor Information Game”, Journal of Financial Research, Issue 1, 2025 (http://www.jryj.org.cn/CN/abstract/abstract1419.shtml)
[4] 21st Century Business Herald - “Summary of the 2024 A-Share M&A Market and 2025 Outlook” (https://www.21jingji.com/article/20250403/herald/7ac574248a1932aea3387c1607d1e3ae.html)
Insights are generated using AI models and historical data for informational purposes only. They do not constitute investment advice or recommendations. Past performance is not indicative of future results.
About us: Ginlix AI is the AI Investment Copilot powered by real data, bridging advanced AI with professional financial databases to provide verifiable, truth-based answers. Please use the chat box below to ask any financial question.