In-Depth Investment Value Analysis of Jiejia Weichuang (300724.SZ): Can TOPCon Order Growth Weather the Photovoltaic Industry Cycle?
Unlock More Features
Login to access AI-powered analysis, deep research reports and more advanced features
About us: Ginlix AI is the AI Investment Copilot powered by real data, bridging advanced AI with professional financial databases to provide verifiable, truth-based answers. Please use the chat box below to ask any financial question.
Related Stocks
I have now collected sufficient information, so let me generate a detailed analysis report for you.
| Indicator Category | Data | Market Interpretation |
|---|---|---|
Market Capitalization |
USD 35.942 billion | Approximately RMB 250 billion |
Current Stock Price |
USD 103.35 | Approximately RMB 720 |
Price-to-Earnings Ratio (P/E) |
10.45x | Significantly lower than industry average |
Price-to-Book Ratio (P/B) |
2.68x | Within a reasonable range |
ROE |
28.13% | Higher than industry average |
Net Profit Margin |
17.45% | Maintains a high profitability level |
Current Ratio |
1.84 | Sound short-term solvency |
| Time Period | Price Change | Market Performance |
|---|---|---|
Past 5 Days |
+7.66% | Strong Uptrend |
Past 1 Month |
+14.50% | Strong Momentum |
Past 6 Months |
+81.06% | Outstanding Performance |
Past 1 Year |
+71.96% | Significantly Outperforms the Market |
YTD |
+7.57% | Strong Year-to-Date Performance |
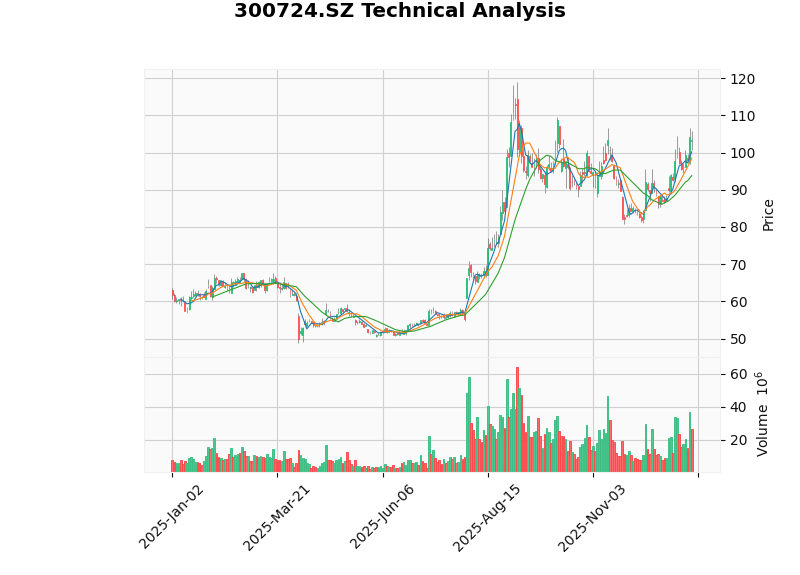
From a technical analysis perspective, Jiejia Weichuang is currently in a clear uptrend. The MACD indicator shows a bullish crossover, and the KDJ indicator signals a golden cross (K value 71.3, D value 66.2). Although there is short-term overbought risk, the upward trend remains intact [0].
According to company announcements and third-party industry statistics, Jiejia Weichuang’s order status is as follows:
- Total Undelivered Contracts (Full Caliber): RMB 44.6 billion - RMB 55.4 billion, with a mid-value of approximatelyRMB 50 billion
- Recognized Contract Liabilities: RMB 6.48 billion (only includes received advance payments)
| Order Type | Amount Range | Accounting Treatment | Remarks |
|---|---|---|---|
| Orders with Received Advance Payments | RMB 16.2 billion - RMB 21.6 billion | Recorded as contract liabilities (RMB 6.48 billion) | Advance payment ratio 30%-40% |
| Signed Orders with Unreceived Payments | RMB 28.4 billion - RMB 33.8 billion | Not recorded as contract liabilities | Advance payments not received or installment payments overdue |
According to accounting standards, contract liabilities only include the portion of
In 2025, the bidding volume for TOPCon equipment exceeded RMB 60 billion, and Jiejia Weichuang’s market share reached over 40%. Its core customer order distribution is as follows:
| Customer Name | TOPCon Capacity Expansion Plan | Share of Jiejia Weichuang’s Orders | Estimated Amount |
|---|---|---|---|
JinkoSolar |
100GW+ | 40%-50% | RMB 15 billion - RMB 20 billion |
Trina Solar |
60GW+ | 30%-40% | RMB 8 billion - RMB 10 billion |
Tongwei Co., Ltd. |
50GW+ | 50%+ | RMB 10 billion - RMB 12 billion |
Overseas Customers |
20GW+ | 30%+ | RMB 6 billion - RMB 8 billion |
Total |
230GW+ | — | Approximately RMB 50 billion |
As can be seen from the order structure, Jiejia Weichuang is deeply tied to leading photovoltaic enterprises such as JinkoSolar, Tongwei, and Trina Solar, whose capacity expansion plans are directly converted into the company’s equipment orders [1][2].
In the first half of 2025, the company achieved operating revenue of RMB 8.372 billion, a year-on-year increase of 26.41%, mainly benefiting from
Key Financial Performance:
- Operating Revenue from Process Equipment: RMB 6.977 billion, a year-on-year increase of 28.68%, accounting for 83.34%
- Operating Revenue from Automation Equipment: RMB 1.009 billion, a year-on-year increase of 15.10%, accounting for 12.05%
- Operating Revenue from Spare Parts: RMB 386 million, a year-on-year increase of 19.11%, accounting for 4.62%
- Net Profit Attributable to Shareholders: RMB 1.83 billion, a year-on-year increase of 49.26% [2][3]
The photovoltaic industry is experiencing a severe overcapacity cycle, and all links are facing great pressure:
| Segment | Capacity Utilization Rate | Price Drop (2024) | Industry Status |
|---|---|---|---|
Polysilicon |
Below 60% | Fell below variable costs | Deep Losses |
Silicon Wafers |
Approximately 70% | Continuing to Decline | Capacity Undergoing Clearing |
Solar Cells |
50%-60% | Dropped over 40% within the year | Severe Overcapacity |
Modules |
50%-60% | Dropped 29% within the year | Severe Intensified Competition |
Notably,
In 2025, solar cell technology routes show obvious differentiation:
| Technology Route | End-of-Year Capacity (GW) | Share | Output (GW) | Share |
|---|---|---|---|---|
TOPCon |
967 | 83% | 580 | 85% |
BC |
83 | 7.1% | 60 | 9% |
HJT |
74 | 6.4% | 19 | 2.7% |
TOPCon still dominates with comprehensive advantages, with an expected output of approximately 580GW, accounting for 85%. However, as technology homogenization intensifies, leading manufacturers maintain competitive advantages through refined upgrades such as 0BB and edge passivation, while small and medium-sized manufacturers face the risk of integration or shutdown [5].
- Normalized Price Wars: The lowest price of TOPCon modules has dropped to RMB 0.60/W, falling below the variable costs of leading industry enterprises
- Slowed Downstream Capacity Expansion: The growth rate of global new photovoltaic installed capacity is expected to drop from 35.9% to around 15% in 2025
- Intensified Trade Barriers: The United States has imposed ultra-high anti-dumping duties on four Southeast Asian countries, and the European Union has initiated a sunset review of anti-dumping and countervailing duties
- Cash Flow Pressure: Equipment enterprises face extended payment collection cycles, and accounts receivable turnover days may exceed 200 days [1][4][6]
- Order Visibility: Based on the current order execution progress, the company’s revenue growth can be sustained until 2026-2027
- Deep Customer Binding: Leading customers account for over 70% of orders, resulting in low order cancellation risk
- Advance Payment Guarantee: Adopts the “3331” payment model, with 60% of equipment payments receivable before shipment
- Full Route Coverage: The only equipment manufacturer worldwide with turnkey supply capabilities for TOPCon/HJT/perovskite
- TOPCon Market Share: Over 60% (company’s caliber), approximately 40%+ according to third-party statistics
- Technological Upgrade Capability: Launched n-TOPCon intelligent production lines to improve production line automation and intelligence levels
- HJT Efficiency Breakthrough: The average conversion efficiency of solar cells from the Changzhou pilot line reaches 25.6%
- Semiconductor Equipment Breakthrough: Completed independent development of the full process of wet process equipment, with localization rate of key components exceeding 95%
- Lithium Battery Vacuum Equipment: Independently developed double-sided wound copper foil sputtering coating equipment successfully rolled off the production line
- Overseas Market Expansion: Malaysian factory is under construction, and the gross profit margin of overseas orders is 10 percentage points higher than that of domestic orders
- Increased Net Profit Margin: Net profit margin on sales is 21.87%, a year-on-year increase of 3.35 percentage points
- Optimized Expense Ratio: Period expense ratio is 4.41%, a year-on-year decrease of 2.44 percentage points
- R&D Investment: R&D expenses in H1 2025 reached RMB 278 million, maintaining technological leadership
- Declining Gross Profit Margin: Gross profit margin in H1 2025 was 29.65%, a year-on-year decrease of 1.97 percentage points
- Cause Analysis: The photovoltaic equipment industry is highly competitive, with continuous annual price reduction pressure on products
- Segment Data: Gross profit margin of process equipment is 28.17%, a year-on-year decrease of 1.55 percentage points
- Negative Operating Cash Flow: Net operating cash flow in H1 2025 was -RMB 776 million, a year-on-year decrease of 496.77%
- Causes: Reduction in received payments and partial funds frozen due to litigation
- Increased Cash Expenditures: Advance payments for raw materials exceeded RMB 8 billion in a single quarter, and capital advances for capacity expansion reached RMB 2 billion in a single quarter
- Downstream Customer Pressure: Solar cell and module prices continue to decline, and customers’ willingness to expand capacity may decrease
- Order Delay Risk: If the growth rate of photovoltaic installed capacity slows to below 15% in 2026, some orders may be delayed
- Valuation Pressure: During the industry downturn, the market may assign lower valuation multiples
| Assessment Dimension | Conclusion | Explanation |
|---|---|---|
Order Visibility |
★★★★★ | RMB 50 billion in order backlog locks in revenue for the next 2-3 years |
Customer Concentration |
★★★★☆ | High proportion of leading customers, but single customer risk is controllable |
Technological Barriers |
★★★★★ | Full route coverage, leading TOPCon market share |
Financial Quality |
★★★★☆ | Improved net profit margin, but cash flow is under pressure |
Cycle Resistance Capacity |
★★★☆☆ | Orders provide a buffer, but industry downturn pressure still exists |
According to forecasts from Soochow Securities and other institutions:
| Financial Indicator | 2025E | 2026E | 2027E |
|---|---|---|---|
| Operating Revenue (RMB 100 million) | 139.9 | 90.5 | 86.9 |
| Net Profit Attributable to Shareholders (RMB 100 million) | 25.4 | 15.3 | 15.2 |
| EPS (RMB) | 7.95 | 4.41 | 4.37 |
| Dynamic P/E | 14x | 22x | 23x |
The current stock price corresponds to:
- Dynamic P/E Ratio: Approximately 14x (2025 forecast)
- Compared to Industry Average: Significantly lower than the photovoltaic equipment sector’s average valuation of 31x
- PEG: Approximately 1.2, no bubble has emerged yet
- Short-Term (Within 6 Months): Buy. Sufficient orders support performance, and technical indicators show the upward trend remains unchanged
- Medium-Term (1 Year): Hold. Need to pay attention to order execution progress and industry cycle changes
- Long-Term (Over 2 Years): Depends on industry capacity clearing progress and the company’s semiconductor business expansion results
- Downstream Capacity Expansion Below Expectations: Slowed growth of photovoltaic installed capacity may lead to order delays or cancellations
- New Product Expansion Below Expectations: Semiconductor equipment business contributes little, and performance still relies on the photovoltaic sector
- Continuous Decline in Gross Profit Margin: Intensified industry competition leads to higher-than-expected annual product price reduction pressure
- Cash Flow Risk: Payment collection speed is slower than expected, and accounts receivable turnover deteriorates
- Trade Policy Risk: Overseas market expansion faces uncertainty from trade barriers
As a leading photovoltaic equipment enterprise, Jiejia Weichuang has strong
[0] Jinling AI Technical Analysis Data
[1] Eastmoney.com - In-Depth Analysis of Jiejia Weichuang’s Orders and Financial Data (https://caifuhao.eastmoney.com/news/20251108212639781324550)
[2] Soochow Securities - Mid-2025 Report Commentary on Jiejia Weichuang (https://pdf.dfcfw.com/pdf/H3_AP202508291736488043_1.pdf)
[3] Jinling AI Company Overview Data
[4] CICC - 2025 Photovoltaic Industry Analysis Report (https://pdf.dfcfw.com/pdf/H3_AP202504061652226616_1.pdf)
[5] EnergyTrend - In-Depth Interpretation of the 2025 Global Photovoltaic Industry Chain (https://www.chinasc.com.cn/article-103-234057.html)
[6] China Industry Information Network - 2025 Year-End Commentary on China’s Photovoltaic Industry (https://finance.china.com/xiaofei/13004691/20260107/49141720.html)
Insights are generated using AI models and historical data for informational purposes only. They do not constitute investment advice or recommendations. Past performance is not indicative of future results.
About us: Ginlix AI is the AI Investment Copilot powered by real data, bridging advanced AI with professional financial databases to provide verifiable, truth-based answers. Please use the chat box below to ask any financial question.