Valuation Risk Analysis Report for China Vanke A (000002.SZ)
Unlock More Features
Login to access AI-powered analysis, deep research reports and more advanced features
About us: Ginlix AI is the AI Investment Copilot powered by real data, bridging advanced AI with professional financial databases to provide verifiable, truth-based answers. Please use the chat box below to ask any financial question.
Related Stocks
Based on the obtained data and charts, I will prepare a comprehensive and systematic Valuation Risk Analysis Report for China Vanke A (000002.SZ).
According to the latest market data, the core valuation indicators of China Vanke A show the following characteristics [0]:
| Valuation Indicator | Value | Industry Comparison | Risk Warning |
|---|---|---|---|
P/E (Price-to-Earnings Ratio) |
-0.99x |
Loss-making | A negative value indicates the company is in a loss-making state |
P/B (Price-to-Book Ratio) |
0.34x | Significantly lower | Share price is approximately 66% below book value |
P/S (Price-to-Sales Ratio) |
0.21x | Extremely low | Weak revenue monetization capability |
Current Share Price |
¥4.96 | 52-week range: ¥4.62-8.22 | In the historical low range |
From a long-term perspective, the valuation of China Vanke A has undergone drastic changes:
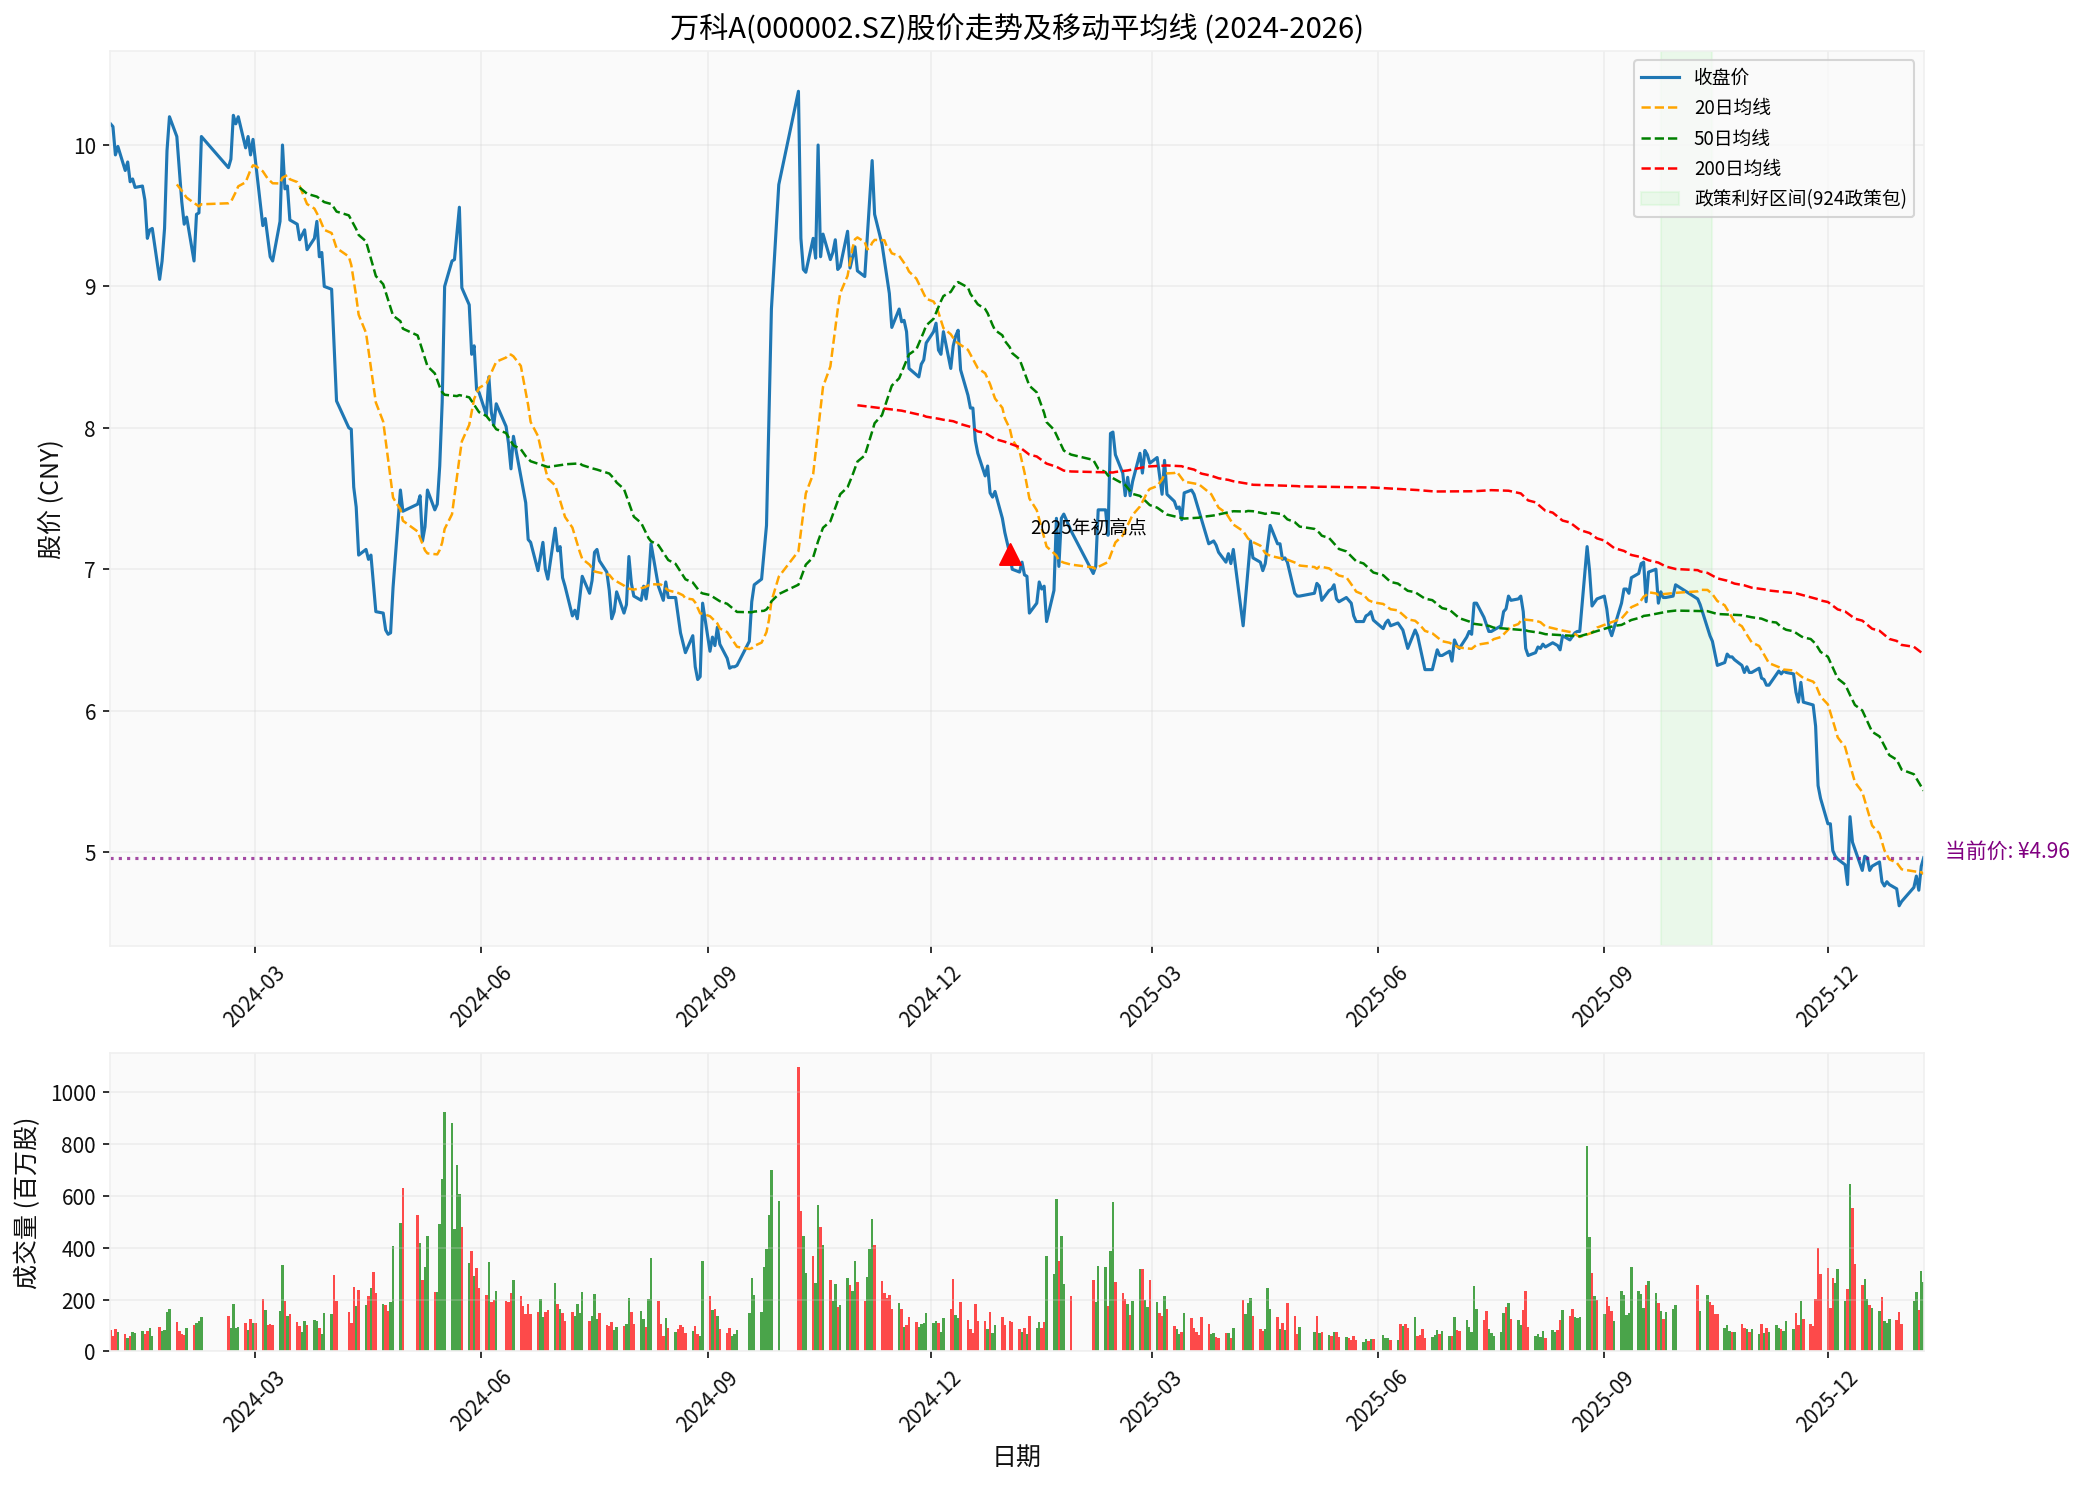
As clearly shown in the chart above [0]:
- 2020 Historical High: Share price was approximately ¥36.37 (2020 high), with the P/E ratio in a reasonable range at that time
- Early 2024: Share price was approximately ¥10, and the P/E ratio turned negative
- September 2025: Stimulated by policy benefits (the 924 Policy Package), the share price rebounded briefly above ¥10
- Current Level: Share price is ¥4.96, downover 85%from the historical high, and down about 50% from the beginning of 2025
- 1-year price change: -28.63%
- 3-year price change: -73.59%
- 5-year price change: -83.34%[0]
The profitability indicators of China Vanke A show that the company is experiencing severe operational difficulties [0]:
| Profitability Indicator | Value | Interpretation |
|---|---|---|
ROE (Return on Equity) |
-31.07% | Severe erosion of shareholder equity |
Net Profit Margin |
-20.92% | Approximately ¥21 loss per ¥100 of revenue |
Operating Profit Margin |
-17.93% | Core business continues to lose money |
Looking at the latest financial report data, the losses of China Vanke A are showing an expanding trend [0]:
| Report Period | EPS | Revenue | Performance Interpretation |
|---|---|---|---|
| Q3 FY2025 | -¥1.35 |
¥56.07 billion | Loss expanded 12 times compared to expectations |
| Q2 FY2025 | -¥0.18 | ¥67.33 billion | Loss continued |
| Q1 FY2025 | -¥0.53 | ¥37.99 billion | Loss persisted |
| Q4 FY2024 | -¥2.66 | ¥123.28 billion | Largest single-quarter loss of the year |
- Sales in Q3 2025 were only ¥100.46 billion, a44.6% year-on-year decrease[1]
- Cumulative net loss in the first three quarters of 2025 reached ¥28.016 billion[1]
- Q3 revenue exceeded expectations by 51.99%, but EPS missed expectations by a wide margin of 1284.68%[0]
The debt pressure faced by China Vanke A is one of the core sources of valuation risks [1]:
| Debt Indicator | Value | Risk Level |
|---|---|---|
Total Interest-Bearing Liabilities |
¥364.26 billion |
Extremely high |
Proportion Maturing Within One Year |
42.7% | Enormous short-term debt repayment pressure |
Proportion of Bank Borrowings |
72.5% | High dependence on bank credit |
According to public information, China Vanke A faces intensive bond repayments in 2025-2026 [1]:
| Time Node | Amount to Be Repaid | Remarks |
|---|---|---|
| December 15, 2025 | ¥2 billion | “22 Vanke MTN004” has applied for extension |
| December 28, 2025 | ¥3.7 billion | “22 Vanke MTN005” |
| November 2025 - June 2026 | ¥15.546 billion | Total principal and interest of domestic bonds |
| First half of 2026 | ¥7.7 billion | Statistic from DM Debt Collection Platform |
China Vanke A’s recent attempt to extend a ¥2 billion bond has triggered a strong market reaction [1]:
- December 10, 2025: The extension proposal put forward at the first bondholder meeting received0 votes in favorand was rejected
- December 17, 2025: A revised new proposal was released
- Core Change: The originally agreed “Shenzhen Metro Group Guarantee” clause wasremoved, with China Vanke providing its own credit enhancement [1]
- The prices of multiple domestic bonds plummeted, some falling to around ¥24, a drop of over 50%
- The share price fell sharply, once hitting ¥4.7, a new low in nearly a decade
- The market’s expectation of state-owned enterprise endorsement fell through, exacerbating the trust crisis
According to industry research data (as of December 5, 2025) [2], the valuation comparison between China Vanke A and major peer companies is as follows:
| Company | Stock Code | P/E (25E) | P/E (26E) | P/B | Rating |
|---|---|---|---|---|---|
China Vanke A |
000002.SZ | Loss-making |
Loss-making |
0.34x |
Distressed |
| Poly Developments | 600048.SH | 20.4x | 17.9x | 0.4x | Stable |
| China Merchants Shekou | 001979.SZ | 19.8x | 17.7x | 0.8x | Stable |
| Company | Stock Code | P/E (25E) | P/E (26E) | P/B | Status |
|---|---|---|---|---|---|
| China Overseas Land & Investment | 0688.HK | 7.9x | 7.5x | 0.3x | Profitable |
| Longfor Group | 0960.HK | 12.5x | 11.3x | 0.4x | Profitable |
China Vanke A (HK) |
2202.HK | Loss-making |
Loss-making |
0.2x |
Distressed |
- China Vanke A is the onlymainstream real estate enterprise that has sustained losses and cannot provide profit guidance
- Although its P/B ratio of 0.34x is similar to that of some state-owned central enterprises and local state-owned enterprises, it is based on sustained losses
- Compared with state-owned central enterprises that can maintain profitability (such as Poly Developments and China Merchants Shekou), China Vanke A lacks fundamental support
The
| Signal Type | Specific Performance |
|---|---|
Profit Expectation |
The market expects the company to be unable to return to profitability in the short term |
Risk Pricing |
Investors demand a higher risk premium |
Value Reassessment |
Shift from growth stock valuation to distressed/bankruptcy valuation |
Based on the above analysis, we assess the extent to which current valuation reflects risks:
-
Liquidity Risk Not Fully Priced In
- The plummeting bond prices (some falling to ¥24) show the market’s high vigilance against default risk
- The removal of Shenzhen Metro’s guarantee may trigger a chain reaction, increasing the risk of cross-default [1]
-
Questionable Asset Quality
- In the downward real estate cycle, inventory and investment properties may face further impairment
- Although the P/B ratio of 0.34x is low, if asset quality deteriorates, the actual liquidation value may be even lower
-
Sustained Negative Operating Cash Flow
- The decline in sales (-44.6%) and the expansion of losses form a vicious cycle [1]
- The lack of “self-hematopoietic capability” means the company is highly dependent on external financing
-
Expectation of State-Owned Enterprise Support
- Shenzhen Metro Group has provided over ¥30 billion in loan support within the year [1]
- If policy intervention increases, additional liquidity support may be obtained
-
Expectation of Industry Bottoming Out
- Real estate sector valuations have continued to recover (multiple policy benefits were released in 2025) [2]
- The worst period for the industry may be coming to an end
| Risk Dimension | Risk Level | Extent of Valuation Reflection | Remarks |
|---|---|---|---|
Solvency Risk |
🔴 Extremely High | ~70% | Large-scale debt maturing in 2026 |
Operational Risk |
🔴 Extremely High | ~80% | Sales and profits continue to deteriorate |
Liquidity Risk |
🔴 Extremely High | ~75% | Negative operating cash flow |
Policy Risk |
🟡 Medium-High | ~50% | Uncertain intensity of state-owned enterprise support |
Industry Cycle Risk |
🟡 Medium-High | ~60% | Uncertain timing of industry bottoming out |
Valuation Risk |
🔴 Extremely High | ~90% | Negative P/E has fully reflected the situation |
Specifically:
-
Negative P/E Ratio Is a True Reflection: The company’s EPS is -¥5.01, ROE is -31.07%, and sustained losses have rendered traditional valuation methods invalid [0]
-
P/B Ratio Hides Risks: The P/B ratio of 0.34x seems cheap, but the actual liquidation value may be lower under asset impairment pressure
-
Debt Risk Is the Core Contradiction: 42.7% of the ¥364.26 billion in interest-bearing liabilities will mature within one year, creating enormous repayment pressure [1]
-
State-Owned Enterprise Endorsement Is Weakening: The removal of Shenzhen Metro’s guarantee marks a marginal weakening of liquidity support, exacerbating the market trust crisis [1]
- Delisting Risk: If sustained losses continue, the company may face delisting risk warnings
- Default Risk: After the bond extension proposal was rejected, the risk of cross-default increased
- Downward Valuation Center: Before industry consolidation is completed, valuations may remain under pressure for a long time
| Valuation Method | Valuation Range | Applicability |
|---|---|---|
P/E Valuation |
Not Applicable | Company is loss-making |
P/B Valuation |
¥3.5-5.5 | Range considering asset impairment |
Liquidation Value |
¥2-4 | Most pessimistic scenario |
Scenario Analysis |
¥5-8 | Neutral scenario under policy intervention |
[0] Jinling AI Financial Database - Real-time Quotations, Financial Analysis and Technical Indicator Data for China Vanke A (January 9, 2026)
[1] Sina Finance - “China Vanke’s Self-Rescue Fails, Changes Are Coming” (https://finance.sina.com.cn/roll/2025-12-18/doc-inhcfepp3198164.shtml)
[2] CMB International - “Real Estate: Total Shrinkage Continues, Price Bottoming Deepens” Industry Research Report (https://www.cmbi.com.hk/upload/202512/20251219277407.pdf)
Insights are generated using AI models and historical data for informational purposes only. They do not constitute investment advice or recommendations. Past performance is not indicative of future results.
About us: Ginlix AI is the AI Investment Copilot powered by real data, bridging advanced AI with professional financial databases to provide verifiable, truth-based answers. Please use the chat box below to ask any financial question.