In-Depth Investment Value Analysis Report on FTAI Aviation
Unlock More Features
Login to access AI-powered analysis, deep research reports and more advanced features

About us: Ginlix AI is the AI Investment Copilot powered by real data, bridging advanced AI with professional financial databases to provide verifiable, truth-based answers. Please use the chat box below to ask any financial question.
Related Stocks
Based on comprehensively collected data and analysis, below is an in-depth investment value assessment report on FTAI Aviation:
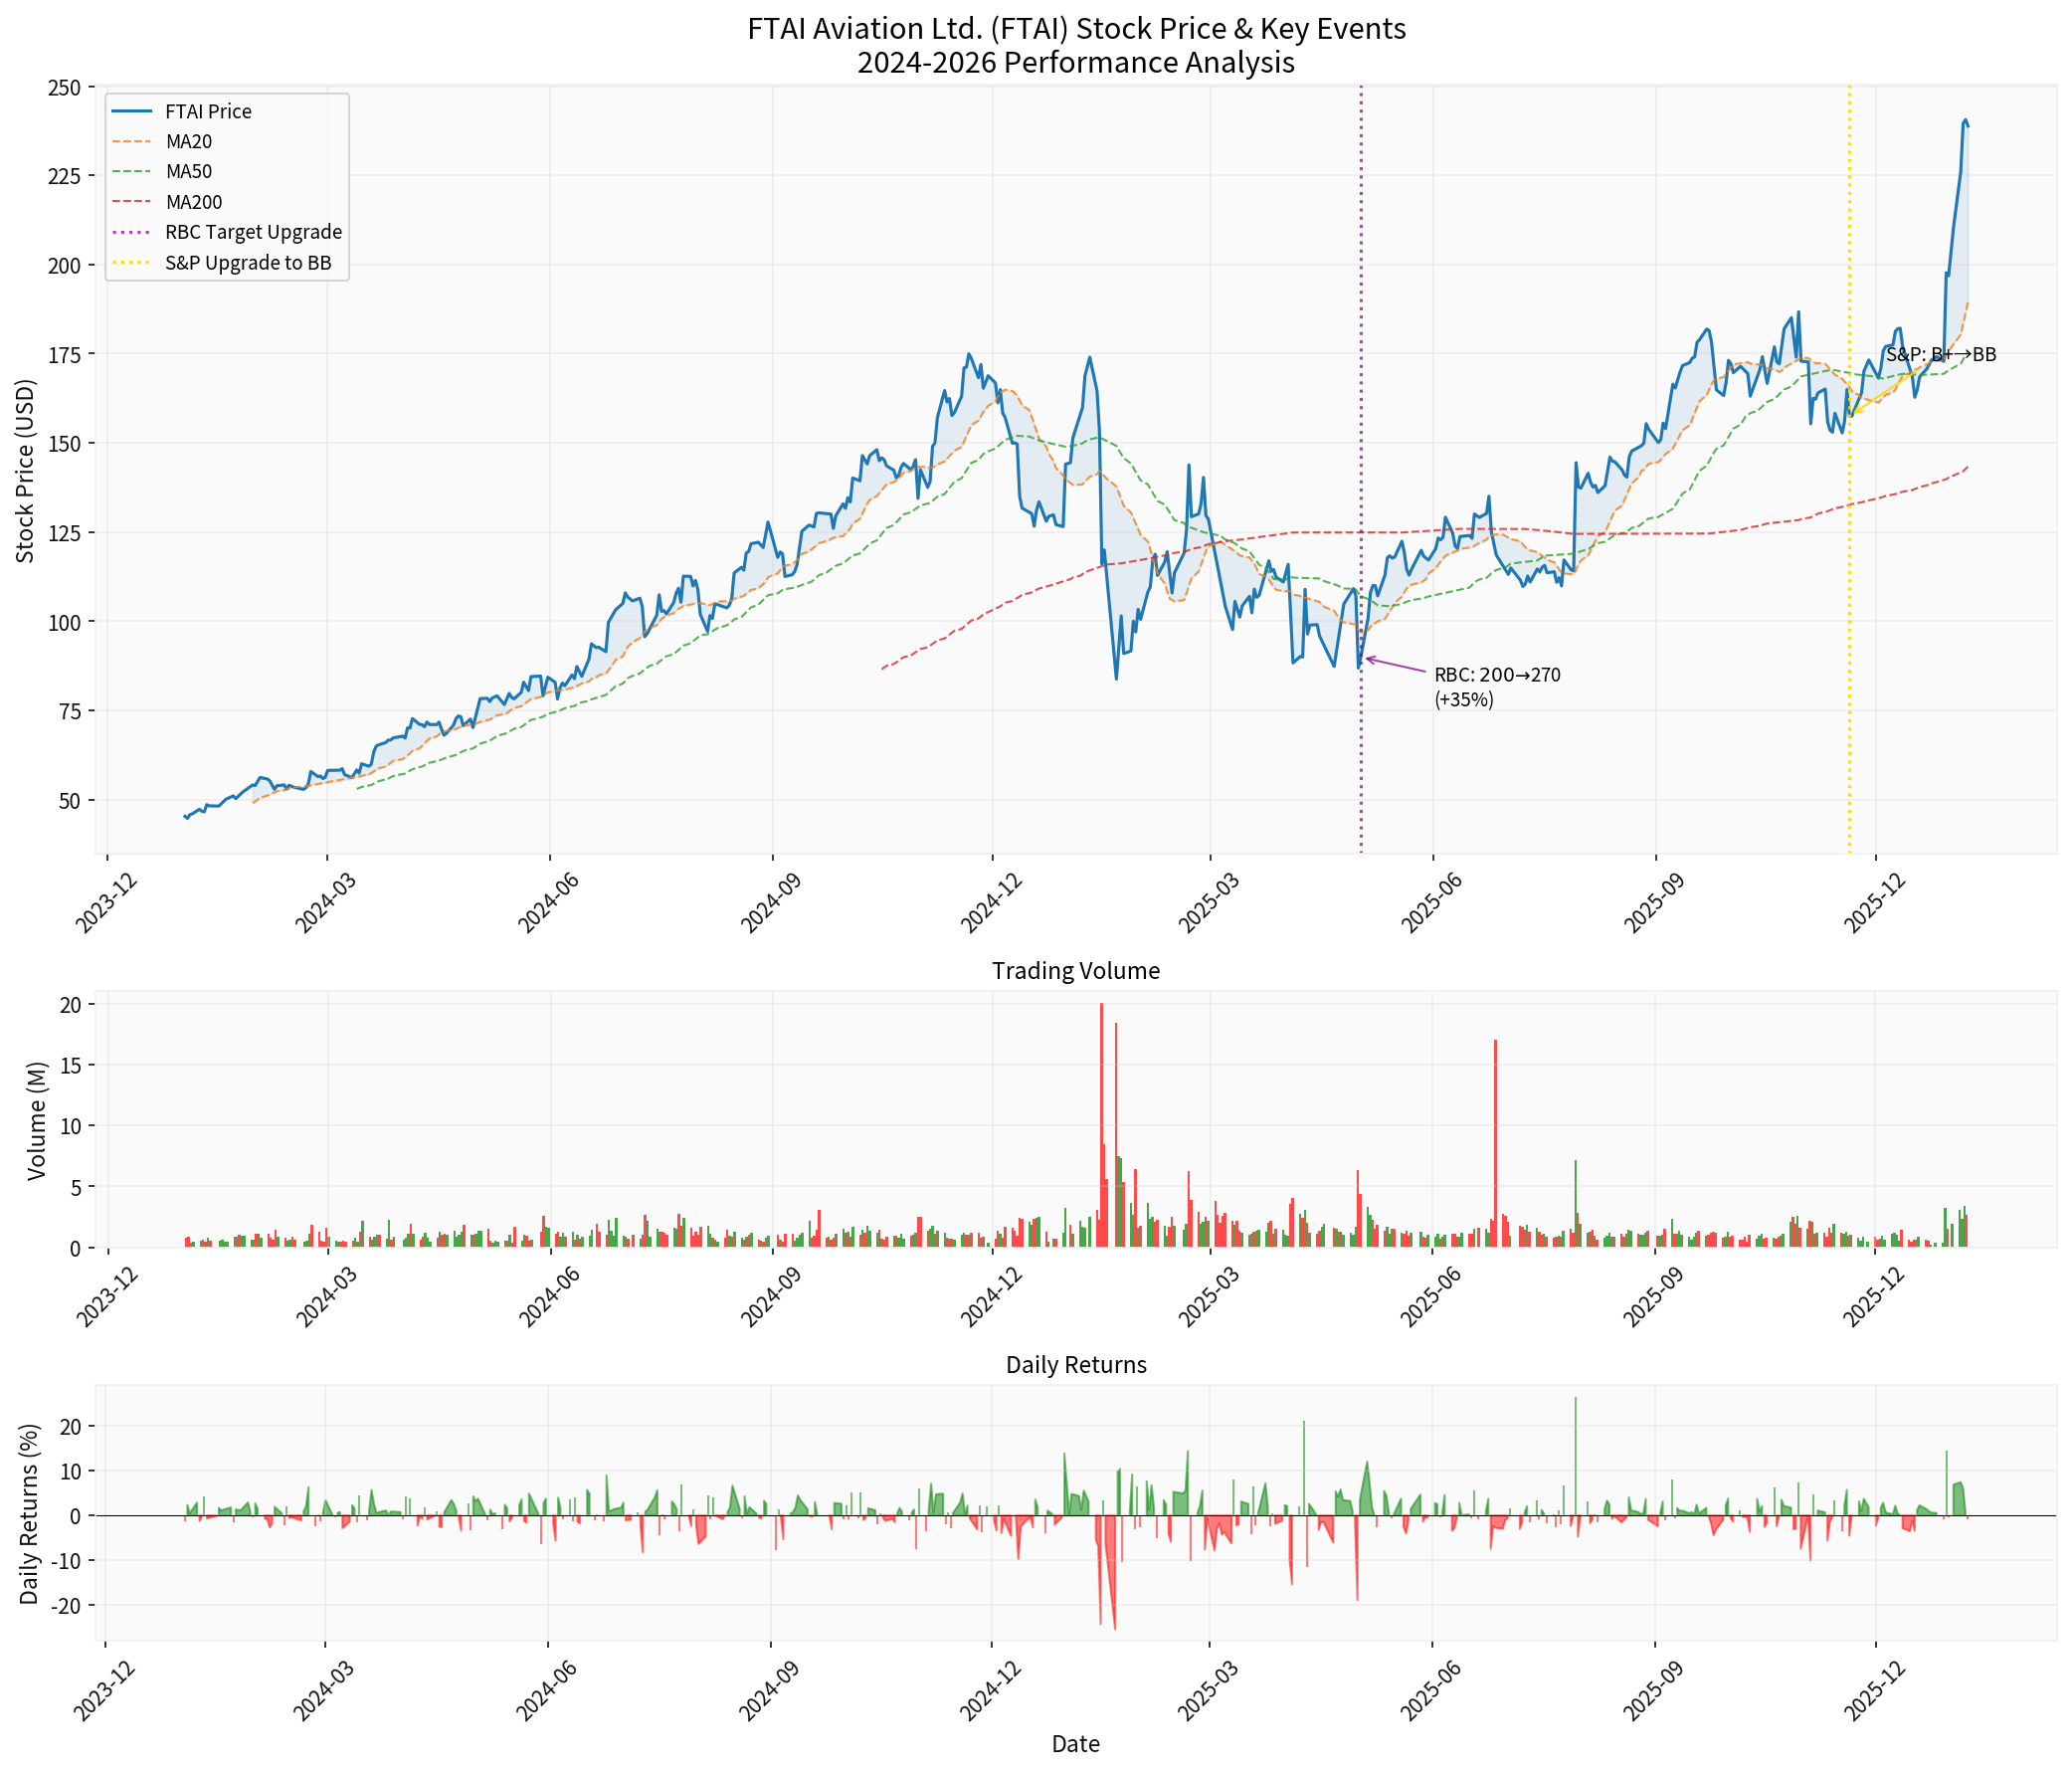
RBC Capital has sharply raised the target price of FTAI Aviation’s stock from $200 to $270, representing a 35% increase. This move reflects Wall Street’s high recognition of the company’s business transformation and growth prospects[1]. Notably, the current stock price is $238.80, and RBC’s target price implies approximately 13% upside potential, which is also significantly higher than the market consensus target price of $225[0].
S&P Global Ratings on November 20, 2025 upgraded the company’s credit rating from “B+” to “BB” with a stable outlook. This credit rating upgrade further validates the substantial improvement in the company’s financial position[2]. S&P noted that the company’s revenue will grow from less than $1.2 billion in 2023 to $2.6 billion in 2025, and exceed $3 billion in 2027, mainly driven by the strong growth of the MRE business[2].
FTAI Aviation operates two core business segments, forming a differentiated business model[0][3]:
- Focuses on the maintenance, overhaul and sales of CFM56-5B, CFM56-7B and V2500 engines
- Q3 2025 revenue reached $459 million, representing a year-over-year increase of 51.3%
- Has multiple maintenance facilities in the US, Canada and Europe
- Accounts for over 50% of projected 2025 EBITDA, and is expected to rise to approximately 70% in 2026
- S&P forecasts that this segment will see 65%-70% revenue growth in 2025 and 10%-13% growth in 2026[2]
- Owns 323 aviation assets, including 48 commercial aircraft and 275 engines
- Achieved 76% asset utilization in Q3 2025
- Provides stable rental income and asset appreciation potential
- Despite a declining revenue share, it remains a high-margin business segment
The global aviation industry is facing aircraft supply constraints, leading to extended service life of existing aircraft and continuously rising demand for engine maintenance and parts replacement. FTAI’s core engine models (CFM56 and V2500) serve the world’s most widely used aircraft such as Boeing 737 and Airbus A320, forming a solid foundation of market demand[2][4].
FTAI’s MRE business provides cost-saving solutions for airlines and aircraft owners, and this differentiated service model has established high customer stickiness. The company achieved asset-light expansion through the 2025 Partnership created under the Strategic Capital Initiative, acting as a service provider and holding a minority stake, optimizing capital efficiency[3][4].
The company is integrating artificial intelligence technology into its engine maintenance business, a strategic initiative regarded as a new growth driver from 2026 onwards. Partnerships with companies such as Palantir have further expanded its data center power business layout, opening up a new revenue stream for the company[4].
| Indicator Category | Indicator Name | Value | Evaluation |
|---|---|---|---|
| Valuation | P/E (TTM) | 50.20x | High but consistent with growth company characteristics |
| Valuation | P/B (TTM) | 97.02x | Above average |
| Profitability | Net Profit Margin | 20.75% | Excellent |
| Profitability | Operating Profit Margin | 30.94% | Strong |
| Profitability | ROE | 3.70% | Moderate, with room for improvement |
| Liquidity | Current Ratio | 5.84 | Very healthy |
| Liquidity | Quick Ratio | 3.27 | Stable |
| Growth | 5-Year Revenue CAGR | 47.5% | Excellent |
The company has shown a strong growth trajectory across all quarters of 2025[0][3]:
- Q3 FY2025(September 2025): Revenue of $667 million (+43% YoY), EPS of $1.10
- Q2 FY2025(June 2025): Revenue of $676 million, EPS of $1.57
- Q1 FY2025(March 2025): Revenue of $502 million, EPS of $0.87
- Q4 FY2024(December 2024): Revenue of $499 million, EPS of $0.84
Management has raised its 2026 adjusted EBITDA guidance from $1.4 billion to $1.525 billion, with approximately $1 billion contributed by Aerospace Products and $525 million by Aviation Leasing[4].
As of the end of Q3 2025, the company’s cash and cash equivalents surged from $115 million at the end of 2024 to $510 million, representing a 343% increase[3][4]. This significant improvement was driven by asset disposals (approximately $770 million) and improved operational efficiency.
S&P expects the company’s debt/EBITDA ratio to remain at approximately 3x in 2025, with an FFO/debt ratio of 22%-26%, indicating continued improvement in credit conditions[2].
Based on DCF model analysis, the company’s intrinsic value is significantly higher than the current market price[0]:
| Scenario | Intrinsic Value | Upside Potential vs Current Price |
|---|---|---|
| Conservative Scenario | $1,232.34 | +416.1% |
| Base Scenario | $1,252.30 | +424.4% |
| Optimistic Scenario | $1,574.70 | +559.4% |
| Probability-Weighted Valuation | $1,353.11 | +466.6% |
- Base scenario uses 5-year historical average data: 47.5% revenue growth, 45.2% EBITDA margin
- WACC (Weighted Average Cost of Capital): 14.4%
- Beta Coefficient: 1.6
The potential upside shown by the DCF valuation is extremely substantial, but the following factors should be noted:
- This valuation is based on the continuation of historical high growth rates
- The current stock price has risen by over 1000% since the beginning of 2024
- The market may have partially priced in growth expectations
- Valuation sensitivity analysis shows that for every 1% increase in WACC, intrinsic value will decrease by approximately 15%
Based on technical analysis[0]:
- Price Trend: Sideways consolidation, no clear trend signal
- Price Range: Reference support level at $189.47, resistance level at $243.89
- KDJ Indicator: K=89.3, D=86.9, J=94.1, showing overbought status
- RSI Indicator: In the overbought zone
- MACD: No crossover signal, but maintains a bullish trend
- Beta Coefficient: 1.6 (relative to S&P 500), high volatility
- Cyclical fluctuations in the global aviation industry may impact demand
- Aircraft engine technology upgrades may alter the market structure
- High Beta value means stock price volatility may be greater than the market
- Supply chain disruptions may impact maintenance operations
- Talent competition may drive up operating costs
- Uncertainty exists regarding the progress of asset disposals
- Current P/E and P/B are at historical highs
- DCF valuation assumptions may be overly optimistic
- The stock price has risen sharply, leading to significant profit-taking pressure
- 65%-70% growth in Aerospace Products business
- Sustained strong demand in the MRE market
- AI technology integration creates new growth drivers
- Abundant liquidity, current ratio of 5.84
- Credit rating upgraded to BB
- Continuous improvement in cash flow position
- DCF shows significant undervaluation, but the market may have priced in growth expectations
- Current valuation is relatively high, requiring time to digest
- 100% of analysts give a Buy rating
- RBC sharply raised target price by 35%
- S&P rating upgrade validates credit improvement
[0] Jinling AI Financial Database - FTAI Aviation company profile, financial analysis, DCF valuation and technical analysis data
[1] S&P Global Ratings - “FTAI Aviation Ltd. Upgraded To ‘BB’ On Improving Credit Metrics; Outlook Stable” (https://www.spglobal.com/ratings/en/regulatory/article/-/view/type/HTML/id/3483032)
[2] S&P Global Ratings - “Research Update: FTAI Aviation Ltd. Upgraded To” (https://www.spglobal.com/ratings/en/regulatory/article/-/view/type/HTML/id/3483032)
[3] SEC EDGAR - FTAI Aviation 10-Q Filing (https://www.sec.gov/Archives/edgar/data/1590364/000159036425000041/ftai-20250930.htm)
[4] StockTwits - “FTAI Aviation Heads Into 2026 With Data Center Power Bet” (https://stocktwits.com/news-articles/markets/equity/ftai-aviation-heads-into-2026-with-data-center-power-bet-a-palantir-tieup/cmxMfUSR4bI)
[5] Beall Investments - “FTAI Aviation Is Getting into the Data Center Game. Should You Buy…” (https://www.beallinvestments.com/news/story/36854870/ftai-aviation-is-getting-into-the-data-center-game-should-you-buy-ftai-stock-here)
Insights are generated using AI models and historical data for informational purposes only. They do not constitute investment advice or recommendations. Past performance is not indicative of future results.
About us: Ginlix AI is the AI Investment Copilot powered by real data, bridging advanced AI with professional financial databases to provide verifiable, truth-based answers. Please use the chat box below to ask any financial question.