Allstate Corp (ALL) Insider Trading Analysis: Assessment of the Impact of Gupta's Stock Sales
Unlock More Features
Login to access AI-powered analysis, deep research reports and more advanced features

About us: Ginlix AI is the AI Investment Copilot powered by real data, bridging advanced AI with professional financial databases to provide verifiable, truth-based answers. Please use the chat box below to ask any financial question.
Related Stocks
Based on comprehensive data analysis, I now present to you a complete investment analysis report.
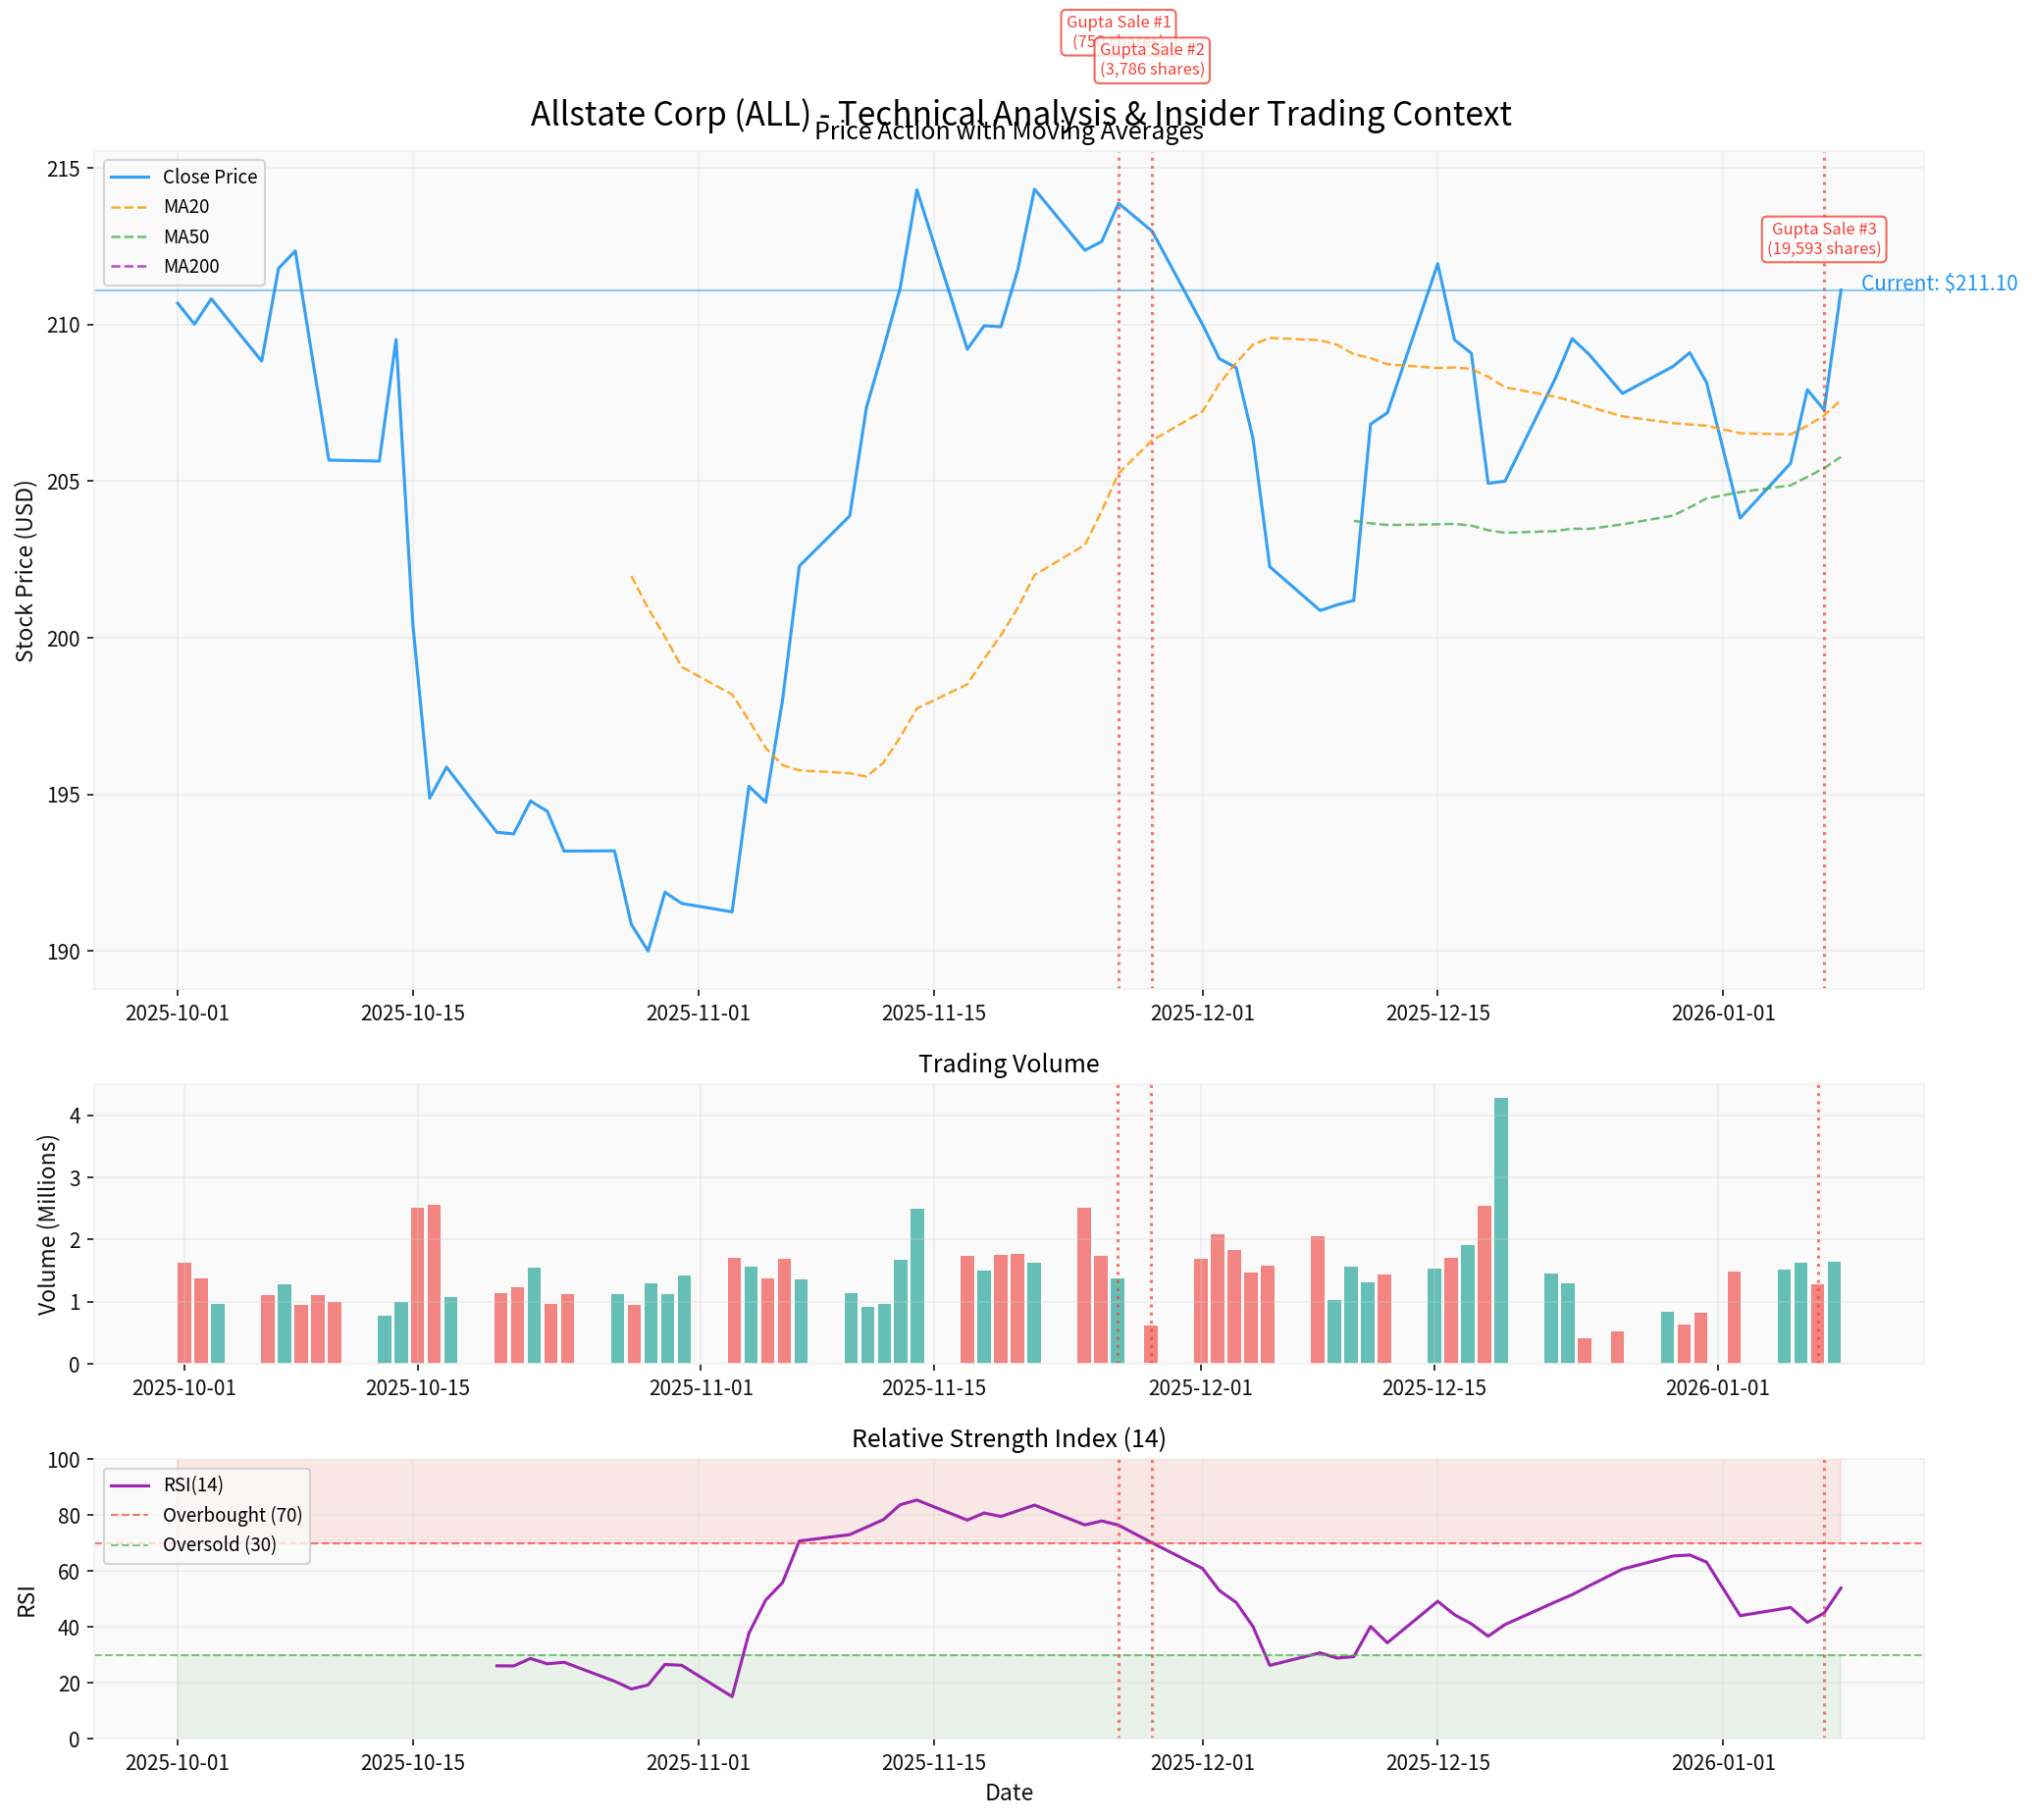
Allstate Corporation (NYSE: ALL) President Suren Gupta conducted a series of share sale transactions between November 2025 and January 2026 [1][2]:
| Transaction Date | Options Exercised (Shares) | Exercise Price | Sale Price | Transaction Amount |
|---|---|---|---|---|
| 2025-11-26 | 750 | $62.32 | $215.01 | ~$161,000 |
| 2025-11-28 | 3,786 | $62.32 | $215.13 | ~$815,000 |
| 2026-01-07 | 19,593 | $62.32 | ~$210.00 | ~$4,115,000 |
- All transactions were executed in accordance with the Rule 10b5-1 Trading Plan(pre-established on June 9, 2025) [1][2]
- Gupta currently directly holds 100,646 sharesof ALL stock (valued at approximately $21.2 million)
- Additionally, he holds 1,335 shares via a 401(k) plan and 7 shares through VVG Holdings LLC
Insider share sales are typically viewed as a negative signal, but
- Prearranged Nature: 10b5-1 plans must be pre-established when the stock price differs from the current price, essentially to avoid suspicion of insider trading
- Compliance Marker: Utilizing a 10b5-1 plan indicates executives are adhering to SEC regulations, with no intent to trade using non-public information
- Time Difference Logic: The plan was established in June 2025 (when the stock price was approximately $200), with limited correlation to the current $211 price
| Indicator | Interpretation |
|---|---|
Continued Shareholding |
After the sale, Gupta still holds shares valued at $21.2 million, demonstrating ongoing confidence in the company |
Profit from Option Exercise |
Selling shares at $210+ with an exercise price of $62.32, yielding over $150 per share, constitutes reasonable financial planning |
Limited Sale Proportion |
This sale accounts for approximately 16.3% of his direct holdings, representing a normal adjustment of shareholdings |
Planned Sale |
Not a panic sell-off, but executed per a pre-determined plan |
| Valuation Metric | Value | Industry Comparison |
|---|---|---|
P/E Ratio (TTM) |
6.85x | Significantly below industry average (~15x) |
P/B Ratio |
2.02x | Reasonable level |
Market Cap |
$55.83B | Large insurance company |
ROE |
35.27% | Excellent |
| Scenario | Intrinsic Value | Relative to Current Price |
|---|---|---|
Conservative Scenario |
$217.99 | +3.3% |
Base Scenario |
$405.56 | +92.1% |
Optimistic Scenario |
$1,004.06 | +375.6% |
Probability-Weighted |
$542.54 | +157.0% |
DCF analysis indicates that the current stock price of $211.10 may be subject to a significant
- Consensus Rating: Buy
- Target Price: $226.00 (implying 7.1% upside potential)
- Target Range: $198.00 - $254.00
- Recent Developments: Most institutions have maintained or upgraded their ratings [0]
| Indicator | Value | Signal Interpretation |
|---|---|---|
MACD |
Golden Cross | Short-term bullish |
KDJ |
K:71.9, D:61.3, J:93.0 | Bullish territory |
RSI(14) |
Normal range | No overbought/oversold condition |
50-Day Moving Average |
~$205 | Stock price is above the moving average |
200-Day Moving Average |
~$188 | Long-term uptrend |
Beta |
0.24 | Low-volatility stock |
Support Level |
$207.60 | Short-term technical support |
Resistance Level |
$212.89 | Short-term technical resistance |
| Metric | Q3 FY2025 | Market Expectation | Beat Margin |
|---|---|---|---|
EPS |
$11.17 | $7.67 | +45.63% |
Revenue |
$17.06B | $15.67B | +8.86% |
- Q2 FY2025: EPS $5.94, Revenue $16.62B
- Q1 FY2025: EPS $3.53, Revenue $16.46B
- Q4 FY2024: EPS $7.67, Revenue $16.51B
- ✅ 10b5-1 plan eliminates insider trading concerns— Transactions are prearranged, compliant operations
- ✅ Substantial executive shareholdings indicate confidence— Still holds shares valued at $21.2 million
- ✅ Sale constitutes profit-taking— Exercise price $62.32 vs. current $211, representing significant profit
- ✅ Low valuation provides a margin of safety— P/E ratio of 6.85x is significantly below historical and industry levels
- ✅ Strong fundamental support— Q3 results exceeded expectations by 45%
- ⚠️ Some sensitive investors may react negatively to any insider share sale
- ⚠️ Minor selling pressure may exist in the short term
- ⚠️ The stock price is near the 52-week high ($215.89), and some investors may choose to take profits
| Evaluation Dimension | Conclusion |
|---|---|
Valuation Attractiveness |
High (P/E ratio only 6.85x, DCF indicates 157% upside potential) |
Insider Trading Signal |
Neutral (Reduction via 10b5-1 plan, not a panic sell-off) |
Fundamentals |
Strong (Earnings exceeded expectations, excellent ROE) |
Technicals |
Stable (Sideways consolidation, clear support levels) |
Comprehensive Rating |
Buy/Hold |
- Entry Range: $207-$210 (near the 50-day moving average support)
- Target Price: $226 (analyst consensus target)
- Stop-Loss Price: $195 (near the lower edge of the 52-week range)
Suren Gupta’s $4.1 million stock sale
- All transactions were executed via a compliant 10b5-1 plan, eliminating concerns about insider trading
- The executive still holds shares valued at over $21 million, demonstrating continued commitment
- The sale only reflects personal financial planning, rather than a negative judgment of the company’s valuation
- The current valuation is attractive (P/E ratio 6.85x), with solid fundamentals
For value investors, the current insider trading dynamics should not be a reason to sell; instead, they may present an opportunity to increase positions in the undervalued range.
[1] SEC Form 4 Filing - Allstate Corp Insider Trading Activity (https://www.sec.gov/Archives/edgar/data/899051/000089905126000004/0000899051-26-000004-index.htm)
[2] StockTitan - Allstate (ALL) President Exercises Options, Sells Shares (https://www.stocktitan.net/sec-filings/ALL/form-4-allstate-corp-insider-trading-activity-31c102af28f7.html)
[3] SEC Form 144 - Report of Proposed Sale of Securities (https://www.sec.gov/Archives/edgar/data/899051/000195917326000186/0001959173-26-000186-index.htm)
[0] Gilin AI Financial Database (Real-time Market Data, Technical Analysis, DCF Valuation Model)
Insights are generated using AI models and historical data for informational purposes only. They do not constitute investment advice or recommendations. Past performance is not indicative of future results.
About us: Ginlix AI is the AI Investment Copilot powered by real data, bridging advanced AI with professional financial databases to provide verifiable, truth-based answers. Please use the chat box below to ask any financial question.