Analysis of Sector Rotation Trends and Investment Strategies in the 2025 U.S. Stock Market
Unlock More Features
Login to access AI-powered analysis, deep research reports and more advanced features
About us: Ginlix AI is the AI Investment Copilot powered by real data, bridging advanced AI with professional financial databases to provide verifiable, truth-based answers. Please use the chat box below to ask any financial question.
Related Stocks
Based on U.S. stock market closing data as of January 8, 2026 [0], the market shows significant divergence characteristics:
| Index | Closing Performance | Market Interpretation |
|---|---|---|
| Dow Jones Industrial Average | +0.85% | Driven by traditional cyclical stocks |
| Russell 2000 Small-Cap Index | +1.11% | Capital inflow into small-cap stocks |
| S&P 500 Index | +0.07% | Weighed down by tech stocks, large-cap index flat |
| Nasdaq Composite Index | -0.29% | Large-cap tech stocks pull back |
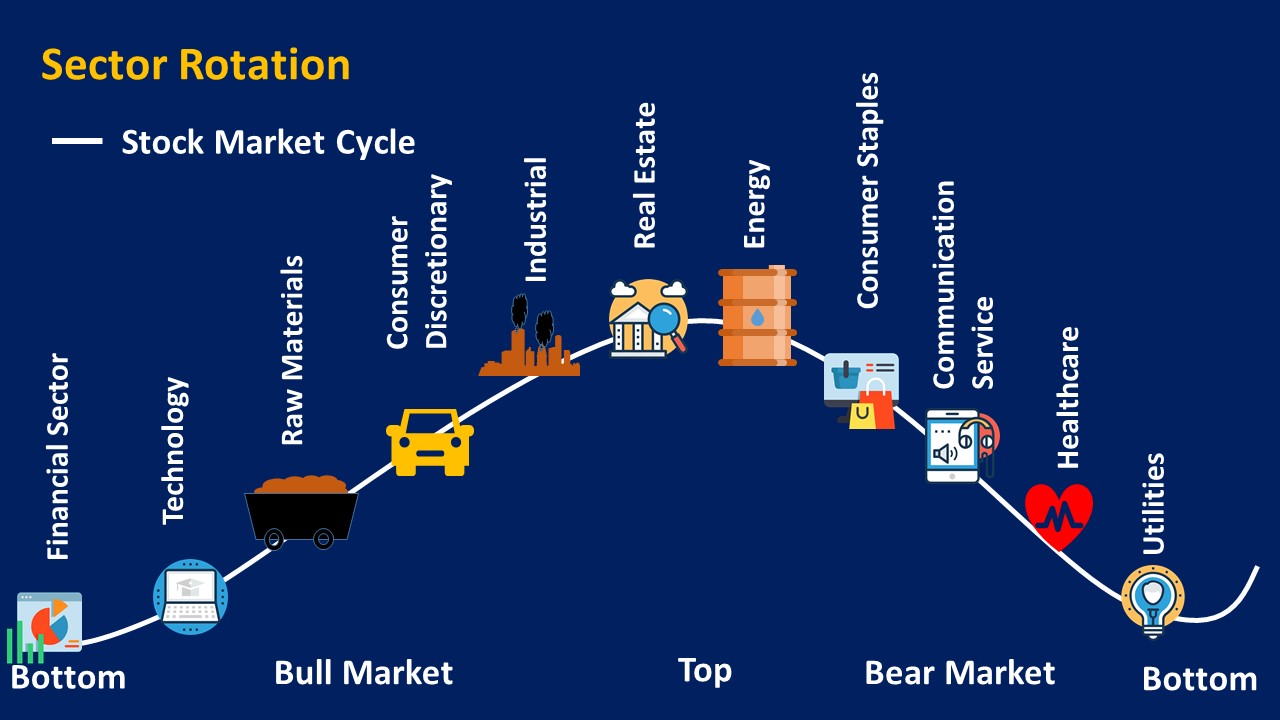
From the sector perspective [0], the
- Top Gaining Sectors: Energy (+2.82%), Consumer Staples (+1.66%), Basic Materials (+1.61%), Real Estate (+1.31%)
- Top Declining Sectors: Utilities (-2.62%), Healthcare (-1.16%), Technology (-0.95%)
This pattern of “strength in traditional cyclical stocks and pullback in high-growth tech stocks” confirms our previously analyzed “great rotation” thesis [1][2].
The current pullback in tech stocks is not accidental, but the result of multiple overlapping factors [1][2]:
-
Accumulated Valuation Pressure: The tech sector’s gain in 2025 was nearly twice that of the S&P 500 Index [1], with valuations at historical highs, making the market more sensitive to negative news
-
Doubts About AI Investment Returns: Despite the ongoing AI boom, investors are beginning to question whether high capital expenditures can be converted into actual earnings growth [1]
-
Profit-Taking by Capital: Thin trading at year-end combined with significant prior gains has led investors to lock in profits
-
Changes in Macro Environment: Uncertainty about the Federal Reserve’s monetary policy path is weighing on valuations of high-growth stocks
Notably, there is also a clear divergence within the tech sector [1]:
- Outperformers: Google, Amazon, Tesla rose over 1%
- Underperformers: Intel fell over 3%, NVIDIA fell over 2%, Microsoft fell over 1%
This divergence indicates that the market is shifting from “undifferentiated chasing of AI concepts” to
Based on the latest market data analysis [1][2], the current U.S. stock market is experiencing the following rotation directions:
┌─────────────────────────────────────────────────────────────┐
│                     Sector Rotation Directions              │
├─────────────────────────────────────────────────────────────┤
│  Big Tech (MAG7) ──→ Cyclical Stocks / Russell 2000 Small-Caps │
│  High-Valuation Growth Stocks ──→ Fair-Valued Value Stocks  │
│  Pure AI Concepts ──→ High-Quality AI Stocks with Profit Conversion Capabilities │
└─────────────────────────────────────────────────────────────┘
- S&P 500 Equal Weight Index outperforms the market-cap weighted index—— Reflects capital flowing to non-AI giant component stocks
- Relative strength in cyclical stocks—— Energy, industrials, and finance sectors performed prominently
- Rotation within defensive sectors—— Consumer staples rose, while utilities and healthcare fell
Despite the tech stock pullback,
- Shift in stock selection logic: From “allocating to the entire AI track” to “selecting high-quality enterprises with AI commercialization implementation capabilities, abundant cash flow, and robust balance sheets”
- Focus on target characteristics: Strong free cash flow, sustainable profit model, technological moat
- Avoid misunderstandings: Do not blindly chase hot stocks, nor sell in panic due to pullbacks
2026 investment strategies should be more
| Sector Type | Rationale for Recommendation | Specific Sectors |
|---|---|---|
Cyclical Stocks |
U.S. GDP is expected to grow by 2.5%, with undervalued pricing | Industrials, Energy, Materials |
Financial Stocks |
Loosening cycle benefits bank profit margins, with valuation advantages | Large Banks, Financial Services |
Healthcare |
Policy uncertainty has receded | Innovative Drugs, Medical Devices |
High-Quality Consumer |
Counter-cyclical attributes, stable daily consumption demand | Leading Consumer Staples Companies |
Based on the current market environment, it is recommended to adopt a
Portfolio Allocation Recommendations:
├── Core Allocation (60-70%)
│   ├── High-Quality Dividend Assets: Utilities, Consumer Staples (Defensive Allocation)
│   ├── Broad-Based Index: S&P 500 Equal Weight ETF (Diversify Risk)
│   └── Financial Sector: Bank Stocks Benefiting from Interest Rate Cut Cycle
│
├── Satellite Allocation (20-30%)
│   ├── Core AI Assets: Selected Tech Leaders with Profit Conversion Capabilities
│   ├── Cyclical Recovery: Industrials, Energy (Benefit from Economic Recovery)
│   └── Small-Cap Stocks: Russell 2000 ETF (Valuation Repair Opportunity)
│
└── Cash Management (10%)
    └── Address Market Volatility, Add Positions at Opportune Times
- Control Tech Stock Exposure: It is recommended that the allocation ratio of a single tech stock or tech sector ETF does not exceed 20-25%
- Focus on Interest Rate Sensitivity: High-dividend sectors such as utilities are sensitive to interest rate changes, so caution is needed
- Maintain Liquidity: Set aside a certain amount of cash to take advantage of position-adding opportunities brought by market volatility
- Diversify Geographic Allocation: Appropriate attention to international market opportunities to diversify the concentration risk of U.S. stocks
Synthesizing institutional views [1][2], the current pullback should be interpreted as a
- ✅ Fundamentals remain robust: GDP growth expected at 2.5%, inflation continues to cool
- ✅ Corporate earnings are resilient: AI capital expenditures continue
- ✅ Normal pullback after hitting all-time highs: Need to digest gains after the strong rebound from late 2025 to early 2026
| Time Node | Focus |
|---|---|
| Q1 2026 | Federal Reserve’s interest rate policy path, corporate earnings season, progress in AI application commercialization |
| H1 2026 | Economic data performance, inflation trend, geopolitical risks |
| Full Year 2026 | Verification of AI investment returns, valuation re-rating, sustainability of sector rotation |
Wall Street is generally optimistic about U.S. stocks in 2026 [1]:
- Average target forecast for S&P 500: 7,500 points
- Optimistic forecast: 8,000 points (Deutsche Bank, Capital Economics)
- Nasdaq Composite Index outlook: Benefiting from continued strong AI applications, it is expected to deliver 10-15% returns
Against the backdrop of the widespread pullback in large-cap tech stocks, 2025 U.S. stock investment strategies should follow the following core principles:
- Go with the Trend: Recognize the rationality of sector rotation, and moderately exit overcrowded tech stock trades
- Selection is King: Shift tech stock investment from “broad-based allocation” to “careful selection”, focusing on enterprises that can truly convert AI into profits
- Diversified Allocation: Increase allocations to sectors such as cyclical stocks, finance, and healthcare to diversify single-sector risks
- Stay Disciplined: Pullbacks are normal in a bull market; avoid making wrong decisions out of panic
- Dynamic Adjustment: Flexibly adjust the portfolio based on changes in the macro economy and corporate fundamentals
[0] Jinling API Market Data (January 8, 2026)
[1] TradingKey - 2026 U.S. Stock Market Forecast by Wall Street: S&P 500 Surges to 8,000! AI Myth Continues but Great Rotation Has Begun (https://www.tradingkey.com/zh-hans/analysis/stocks/us-stock/251424510-us-stock-preview-prediction-bullish-wall-street-ai-tradingkey)
[2] Moomoo - Analysis of Market Pullback on January 7, 2026: Sector Rotation and Investment Strategies (https://www.moomoo.com/hans/community/feed/07-jan-2026-market-pullback-as-investors-rotate-out-of-115856309354502)
[3] Securities Times - U.S. Tech Stocks Weaken, Buying Opportunity May Be Near (https://www.stcn.com/article/detail/3564994.html)
Insights are generated using AI models and historical data for informational purposes only. They do not constitute investment advice or recommendations. Past performance is not indicative of future results.
About us: Ginlix AI is the AI Investment Copilot powered by real data, bridging advanced AI with professional financial databases to provide verifiable, truth-based answers. Please use the chat box below to ask any financial question.