Analysis Report on the Impact of the Trump Administration's IEEPA Tariff Measures: A Panoramic View of Country, Industry, and Valuation Shocks
Unlock More Features
Login to access AI-powered analysis, deep research reports and more advanced features
About us: Ginlix AI is the AI Investment Copilot powered by real data, bridging advanced AI with professional financial databases to provide verifiable, truth-based answers. Please use the chat box below to ask any financial question.
Related Stocks
Based on the latest collected data and analysis, I will provide you with a systematic and comprehensive report analyzing the differentiated impacts of the Trump Administration’s IEEPA-based tariff measures on different countries and industries, as well as the potential shocks to corporate valuations.
The International Emergency Economic Powers Act (IEEPA) was first passed in 1977, aiming to grant the President broad authority to regulate international economic activities during a national emergency[1]. On January 20, 2025, the Trump Administration issued the “America First Trade Policy” executive order, marking the official launch of the IEEPA tariff strategy[2].
- February 1, 2025: Trump declared a national emergency targeting China, Canada, and Mexico citing “fentanyl smuggling” and “trade deficits”, imposing 25% (later raised to 20%) and 25% tariffs respectively[1][3]
- April 2, 2025: Announced “reciprocal tariffs” on almost all trading partners on “Liberation Day”, universally imposing a 10% benchmark tariff, with rates as high as 34%-50% for specific countries[1][4]
- August 7, 2025: Reciprocal tariffs officially took effect after the 90-day suspension period expired[1]
- August 29, 2025: Terminated the de minimis exemption for packages valued under $800[1]
- November 5, 2025: The Supreme Court held oral arguments in the “Learning Resources v. Trump” case, with the ruling pending[1]
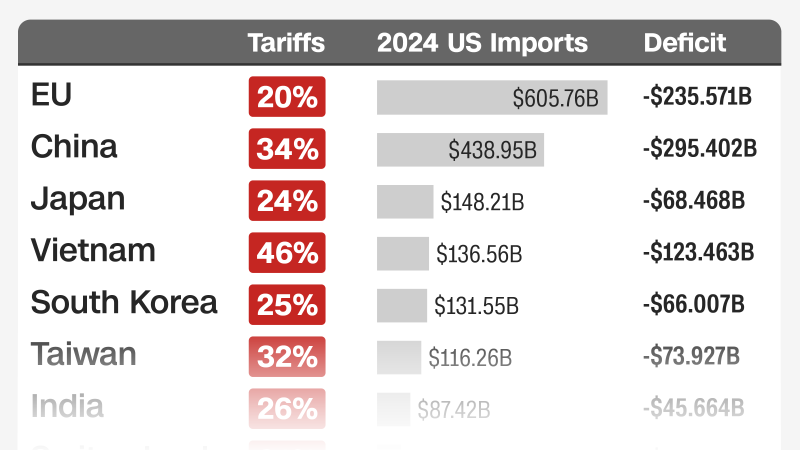
According to the latest executive orders, tariff rates faced by different countries vary significantly[5][6]:
| Country/Region | Reciprocal Tariff Rate | Composite Tariff Rate |
|---|---|---|
| Mainland China | 34% | ~47.5% (including previous measures) |
| Vietnam | 46% | ~20% (after negotiations) |
| EU | 20% | 15% |
| Japan | 24% | 15% |
| India | 26% | 50% (including punitive tariffs on Russian oil) |
| Mexico | 25% | Exempt under USMCA |
| Canada | 35% | Exempt under USMCA |
| Brazil | 50% | 50% |
| Taiwan | 32% | Semiconductor Exemption |
| South Korea | 25% | 15% |
| Bangladesh | 37% | 37% |
| Cambodia | 49% | 49% |
Based on differences in trade dependence, U.S. market share, and negotiating position, I classify the affected countries into four tiers:
| Country | Vulnerability Indicators | Core Risks |
|---|---|---|
China |
Exports to the U.S. account for ~3.8% of GDP; largest source of U.S. imports (13.4% of total U.S. imports)[7] | Highest composite tariff rate (47.5%), combination of fentanyl tariffs and reciprocal tariffs; significant profit pressure on export enterprises; countermeasures via rare earth export controls[1][4] |
Vietnam |
Exports to the U.S. account for ~33% of GDP; manufacturing sector highly dependent on the U.S. market[6] | Initial 46% tariff reduced to 20%, but facing 40% transshipment tariff risks; status as the top supply chain transfer destination challenged[6] |
Mexico |
Exports to the U.S. account for ~31% of GDP; core beneficiary of nearshoring[3] | Complex game between 25% tariffs and USMCA exemption clauses; highly integrated automotive industry chain, with Ford, GM and other automakers warning of production disruptions[7][8] |
| Country | Vulnerability Indicators | Core Risks |
|---|---|---|
India |
Exports to the U.S. account for ~6.5% of GDP; fourth-largest trading partner of the U.S.[5] | 50% composite tariff rate (including 25% secondary tariff on Russian oil) severely erodes competitiveness; pharmaceuticals, textiles, and IT services sectors impacted[5] |
Brazil |
Exports to the U.S. are dominated by agricultural products and resources; moderate dependence on manufacturing exports[5] | 50% tariff leads to surging export costs for soybeans and iron ore; rising political pressure from agricultural states[5] |
Bangladesh |
Textile sector highly dependent on the U.S. market (accounting for over 80% of exports)[6] | 37% tariff directly hits garment exports; industry profit margins typically only 8-12%, making it difficult to fully pass on costs[6] |
Cambodia |
Garment manufacturing dominates; exports to the U.S. account for ~30% of GDP[6] | One of the highest tariff rates at 49%, almost completely offsetting cost advantages[6] |
| Country | Vulnerability Indicators | Core Risks |
|---|---|---|
Japan |
High-end manufacturing; exports to the U.S. dominated by automobiles and machinery[5] | 24% reciprocal tariff can be partially absorbed via product upgrades; automotive industry has initiated cost transfer[5] |
South Korea |
Semiconductor and display sectors highly dependent on the U.S.[5] | Differentiated impacts between 25% reciprocal tariffs and semiconductor exemptions; limited pressure on Samsung and SK Hynix[5] |
Taiwan |
Semiconductor sector accounts for ~15% of GDP[5] | 32% reciprocal tariff but semiconductors are exempt; indirect impacts on IC design and testing sectors[5] |
EU |
Diversified economy; exports to the U.S. spread across multiple industries[5] | 20% tariff is relatively moderate; differentiated impacts on luxury goods, automobiles, and agricultural products[5] |
According to analysis from Oqtima Geopolitical Analysis[9]:
| Currency | Potential Depreciation Range | Drivers |
|---|---|---|
Mexican Peso (MXN) |
5-7% | USMCA uncertainty, manufacturing supply chain disruptions, risk of trade surplus compression[9] |
Chinese Yuan (CNY) |
Gradual depreciation | Declining export competitiveness, capital outflow pressure, PBOC’s gradual depreciation strategy[9] |
South Korean Won (KRW) |
3-5% | Vulnerability of tech exports, combined with geopolitical risks[9] |
Based on research from J.P. Morgan, Mitsui & Co., and RBC Capital Markets[4][7][8], the following industries are ranked by vulnerability:
- Bangladesh, Cambodia, Vietnam: Textile exports account for over 60% of total exports to the U.S.[6]
- Root cause of vulnerability: Average industry net profit margin is only 8-12%, with extremely weak tariff pass-through ability
- Typical case: Nike’s gross margin compressed by 300 bps due to tariffs, with China sales declining 17%[10]
- Vietnam, Mainland China: Consumer electronics exports to the U.S. account for over 40%[4]
- Root cause of vulnerability: Supply chains are highly concentrated in assembly bases in the Pearl River Delta (China) and northern Vietnam
- Typical case: Apple reported a 3-4% increase in supply chain costs, but has limited pricing power for high-end products[9]
- China, Vietnam, Mexico: Top three sources of U.S. furniture imports[8]
- Root cause of vulnerability: Dual pressure from raw material costs and tariffs, high consumer price sensitivity
- Typical case: Williams-Sonoma, Wayfair face 30-50% phased tariffs[9]
- Mexico, Canada, Japan, Germany: Concentrated sources of U.S. automobile imports[3]
- Root cause of vulnerability: Highly integrated industry chain, difficult to restructure in the short term
- Typical case: Ford, GM warn of production disruptions; Canadian auto parts suppliers face shutdown risks[7][8]
- China, Vietnam, Indonesia: Global footwear manufacturing hubs[10]
- Root cause of vulnerability: Sensitive to labor costs, limited brand premium
- Typical case: Nike’s China sales declined 17% due to tariffs and domestic market competition[10]
- China, Mexico: Main sources of U.S. plastic imports[8]
- Root cause of vulnerability: Downstream packaging industry has thin profit margins, making it difficult to absorb costs
- Brazil, Canada, Mexico: Soybeans, pork, fruits and vegetables exported to the U.S.[5]
- Root cause of vulnerability: Sensitive to price fluctuations, combined with seasonal factors
- Chinese countermeasures: Imposed 10-15% tariffs on U.S. agricultural products[1]
- Germany, Japan, China: Industrial equipment exports[8]
- Root cause of vulnerability: Technology-intensive, partial cost pass-through possible
- Typical case: Caterpillar, Deere face input cost pressure and weakened overseas demand[9]
- Taiwan, South Korea, Japan: Global core chip manufacturing hubs[5]
- Special exemption: Semiconductors are fully exempt from reciprocal tariffs, with limited indirect impacts on downstream packaging and testing sectors[5]
Upstream Materials → Midstream Manufacturing → Downstream Brand/Retail → End Consumers
    ↓            ↓            ↓              ↓
Rare Earths/Metals    Assembly Processing     Brand Premium       Price Sensitivity
(China-dominated)   (Vietnam/Mexico)   (Limited)        (High)
- Cost Transmission Diminishing Effect: Bargaining power decreases from upstream raw materials → midstream manufacturers → downstream brands → retailers
- Time Lag Effect: It takes approximately 3-6 months for impacts to be transmitted to end consumer prices, with enterprises bearing cost pressures in the interim
- Differentiated Pass-Through Ability: High-premium brands (Nike, Apple) can partially pass on costs; mass consumer goods struggle to do so
Based on RBC Capital Markets’ earnings call analysis[8]:
| Industry | Profit Impact Mechanism | Expected EPS Adjustment |
|---|---|---|
Retail (WMT/TGT/COST) |
Cost absorption + price hike constraints | 2025 Q4 guidance shows margin compression[9] |
Apparel (NKE/ADDYY) |
Difficulty passing on tariff costs | Gross margin compressed by 200-400 bps[10] |
Automobiles (F/GM) |
Rising production costs + slowing demand | 2026 earnings forecast lowered by 5-10%[9] |
Technology (Apple) |
3-4% increase in supply chain costs | Limited impact, strong pricing power for high-end products[9] |
Industrial (CAT/DE) |
Cost pressure + weakened overseas demand | Export chain enterprises face profit pressure[9] |
According to data from Oqtima Geopolitical Analysis[9]:
| Enterprise Type | P/E Compression Range | Drivers |
|---|---|---|
Highly export-dependent retailers |
10-15% | Margin risks, uncertainty in consumer spending[9] |
Textile/footwear manufacturers |
15-25% | Direct tariff impact, margin compression[10] |
Auto parts suppliers |
10-20% | Supply chain disruption risks, declining capacity utilization[8] |
Tech hardware manufacturers |
5-10% | Partial cost pass-through possible, relatively rigid demand[9] |
Tariff Shock → Earnings Downgrades → Deteriorating Cash Flow → Rising Credit Risk → Stock-Bond Sell-Off
    ↓         ↓          ↓           ↓
Valuation Compression   EPS Decline   ROE Reduction    Rising Debt Costs  Expanded Risk Premium
- Earnings Side: Directly impacts net profit margins, with net profits of high-dependence enterprises expected to decline 8-15% in 2025
- Cash Flow Side: Increased working capital demand, extended accounts receivable cycles
- Cost of Capital Side: Widening credit spreads, higher debt refinancing costs
- Valuation Side: Rising equity risk premium (ERP), higher WACC in DCF models
| Indicator | Data | Interpretation |
|---|---|---|
| China Sales | 17% YoY decline | Double pressure from intensified domestic competition and tariffs[10] |
| Gross Margin Compression | 300 bps | Direct erosion from tariffs[10] |
| Stock Performance | 22% annual decline | Market pricing in pessimistic expectations[10] |
| P/E Historical Comparison | Below 5-year average | Valuations have fully priced in risks[10] |
| Indicator | Data | Interpretation |
|---|---|---|
| Supply Chain Cost Increase | 3-4% | Relatively manageable[9] |
| Pricing Power | Strong | Rigid demand for high-end products[9] |
| Valuation Impact | Limited | Buffered by semiconductor exemptions[9] |
| Indicator | Data | Interpretation |
|---|---|---|
| Production Costs | Significant increase | Transmitted from import tariffs on parts[8] |
| EV Transformation Costs | Compounded pressure | Double blow from battery import tariffs[9] |
| Employment Impact | Potential risk | Capacity adjustment pressure[7] |
Scenario assumptions based on DCF models:
| Industry | Base Case | Optimistic Scenario (Tariff Relaxation) | Pessimistic Scenario (Tariffs Maintained/Upgraded) |
|---|---|---|---|
Textile Manufacturing |
8-10x EV/EBITDA | 10-12x | 6-8x |
Electronics Assembly |
12-15x | 14-17x | 10-12x |
Auto Parts |
7-9x | 9-11x | 5-7x |
Retail |
15-18x | 18-22x | 12-15x |
Tech Hardware |
20-25x | 25-30x | 18-22x |
- Semiconductors: Exempt from tariffs, rigid demand from AI/data centers[5]
- U.S. Domestic Consumption: Avoid export shocks, focus on leading essential consumer goods enterprises
- Healthcare: Rigid demand, high policy immunity
- Textile and Apparel: Direct impact, margin-sensitive[6]
- Auto Parts: High supply chain risk premium[8]
- Emerging Market Export-Oriented Stocks: Risk of currency and valuation double hit[9]
- Negotiation Progress-Driven: Vietnam, India, etc., which obtained tariff concessions through negotiations[5]
- Supply Chain Restructuring Beneficiaries: Mexico (nearshoring), India (diversification)[6]
| Instrument | Applicable Scenario | Recommended Allocation Ratio |
|---|---|---|
Currency Hedging |
Currency depreciation risk | Short positions in MXN, KRW |
Interest Rate Futures |
Rising inflation expectations | Short positions in short-end contracts |
Volatility Strategy |
VIX upside risk | VIX futures/options |
Gold |
Safe-haven demand | 3-5% allocation |
Tail Risk Funds |
Extreme events | 1-2% allocation |
-
Policy Level:
- Supreme Court ruling on IEEPA (expected early 2026)[1]
- USMCA renegotiation progress[3]
- Renewal/termination of national emergency declarations
-
Data Level:
- U.S. CPI/PPI (inflation transmission)
- U.S. import data (actual demand changes)
- Emerging market trade surplus changes
-
Market Level:
- High-yield spreads (credit risk)
- Emerging market currency volatility
- Earnings revision range of export-oriented enterprises
- Risk assets rebound 5-10% in the short term
- Emerging market currencies appreciate 3-5%
- Valuations of high-export-dependence enterprises recover
- Retail stock P/E expands by 5-8%
- Textile/automotive stock P/E expands by 10-15%
- Risk assets come under pressure, volatility rises
- Export-dependent currencies depreciate further
- Corporate earnings expectations are revised downward
- P/E of high-dependence enterprises compresses by another 5-10%
- Supply chain restructuring accelerates, benefiting Mexico/India
- Congress may pass legislation to limit presidential tariff authority
- Or attach restrictive clauses to budget bills
-
Country Level: China, Vietnam, India, Brazil, and Mexico are the most vulnerable countries, with China and Vietnam facing the highest risks due to their heavy dependence on U.S. manufacturing exports[1][4][5]
-
Industry Level: Textile and apparel manufacturing, electronics assembly, furniture, and auto parts are the most vulnerable industries, characterized by high margin sensitivity and weak bargaining power[6][8][10]
-
Valuation Level: High-export-dependence enterprises face 10-25% P/E compression and 8-15% downward revisions in profit expectations, with some enterprises facing rising credit risks[9][10]
-
Transmission Mechanism: Tariff shocks are transmitted step-by-step through the supply chain, with upstream material monopolists (rare earths) relatively benefiting, while midstream assembly sectors bear the brunt[4][9]
- Short-Term (1-3 Months): Avoid high-export-dependence targets, wait for policy clarity
- Mid-Term (3-6 Months): Focus on supply chain restructuring beneficiaries (Mexico, India)
- Long-Term (6-12 Months): If IEEPA tariffs are overturned, valuation recovery opportunities are expected; if they persist, the risk premium of export-dependent assets needs to be repriced
[1] Wikipedia
Insights are generated using AI models and historical data for informational purposes only. They do not constitute investment advice or recommendations. Past performance is not indicative of future results.
About us: Ginlix AI is the AI Investment Copilot powered by real data, bridging advanced AI with professional financial databases to provide verifiable, truth-based answers. Please use the chat box below to ask any financial question.