In-Depth Analysis Report on Expedia Group (EXPE)
Unlock More Features
Login to access AI-powered analysis, deep research reports and more advanced features

About us: Ginlix AI is the AI Investment Copilot powered by real data, bridging advanced AI with professional financial databases to provide verifiable, truth-based answers. Please use the chat box below to ask any financial question.
Related Stocks
Based on the collected data, I will provide you with a comprehensive analysis report on Expedia Group (EXPE).
Expedia Group is one of the world’s largest online travel agencies (OTAs), with a mission to “power travel for everyone, everywhere” [0]. The company provides travel booking services to consumers and corporate clients through its multiple brands.
- B2C Business:Expedia, Hotels.com, Vrbo, Orbitz, Travelocity, ebookers, etc.
- B2B Business:Travel technology solutions such as Rapid API, TAAP, etc.
- Meta-search Business:trivago (controlled stake)
The online travel market shows a clear
| Competitor | Market Position | Core Advantages |
|---|---|---|
Booking Holdings |
Global Leader | Dominant position in the European market, 28,000 hotel inventory, Genius loyalty program |
Expedia Group |
Second-Largest OTA | Deep roots in the U.S. market, robust growth in B2B business, diversified brand portfolio |
Airbnb |
Alternative Accommodation Disruptor | 7.7 million active listings, unique experience business, high brand recognition |
Trip.com Group |
Asia-Pacific Market Leader | Strong position in China’s outbound travel market, robust growth in international business |
- Booking Holdings: Approximately 28%
- Expedia Group: Approximately 16%
- Airbnb: Approximately 10%
- Others: Approximately 46% [1]
-
Diversified Brand Portfolio
- Covers different consumer groups and geographic markets
- Vrbo has a differentiated position in the vacation rental sector
- One Key unified loyalty program (launched in the U.S. in 2023, UK in 2024)
-
Robust Growth in B2B Business
- Double-digit booking growth sustained in B2B business in 2025
- Technology platform (Rapid API) provides white-label solutions for partners
- Has become a key competitive differentiator
-
Modernized Technology Platform
- Completed unification of the front-end technology stack for core B2C brands
- Hotels.com (2022) and Vrbo (2023) migrated to the unified platform
- Continuous enhancement of AI/ML capabilities, with partnerships established with OpenAI and others
-
Extensive Hotel Inventory Coverage
- Over 3.5 million accommodation properties
- 2.5 million of which offer alternative accommodations through Vrbo
| Metric | 2024 | 2023 | YoY Change |
|---|---|---|---|
| Revenue | $13.691 Billion | $12.839 Billion | +6.6% |
| Net Income | $1.234 Billion | $0.797 Billion | +54.8% |
| Diluted Earnings Per Share (EPS) | $8.95 | $5.31 | +68.5% |
| Operating Margin | 9.6% | 8.0% | +1.6 ppts |
| Gross Margin | 89.5% | 87.8% | +1.7 ppts |
Source: Expedia 2024 10-K Filing [2]
- Merchant Model: 69% ($9.439 Billion)
- Agency Model: 23% ($3.169 Billion)
- Advertising & Other: 8% ($1.083 Billion)
- Accommodation Business: 80% ($10.950 Billion) — Core revenue source
- Airline Business: 3% ($0.428 Billion)
- Advertising Media: 7% ($0.954 Billion)
- Other: 10% ($1.359 Billion)
- Operating Cash Flow: $3.085 Billion (2024)
- Free Cash Flow: $2.329 Billion
- Sufficient cash reserves and good financial flexibility
- Cash and Cash Equivalents: $4.183 Billion
- Total Assets: $22.388 Billion
- Current Ratio: 0.72 (slightly below 1, reflecting the industry characteristic of high advance payments)
- Long-Term Debt: $5.223 Billion
Expedia’s profitability improved significantly in 2024:
- Net profit margin increased from 6.2% in 2023 to 9.0%
- ROE turned positive from negative to approximately 79%
- Continuous optimization of operational efficiency, with improved return on marketing spend
| Quarter | Revenue | EPS | Market Expectation |
|---|---|---|---|
| Q1 2025 | $2.99 Billion | $0.40 | In Line with Expectations |
| Q2 2025 | $3.79 Billion | $4.24 | Beat Expectations |
| Q3 2025 | $4.41 Billion | $7.57 | Beat Expectations by 8.6% |
- 7% growth in room nights
- 5% growth in total bookings (17% growth in B2B business)
- International market outperformed North American market
| Metric | Value |
|---|---|
| Current Price | $297.18 |
| 52-Week High | $300.46 |
| 52-Week Low | $130.01 |
| Distance from High | -1.1% |
| Market Capitalization | $34.77 Billion |
| Beta Coefficient | 1.43 |
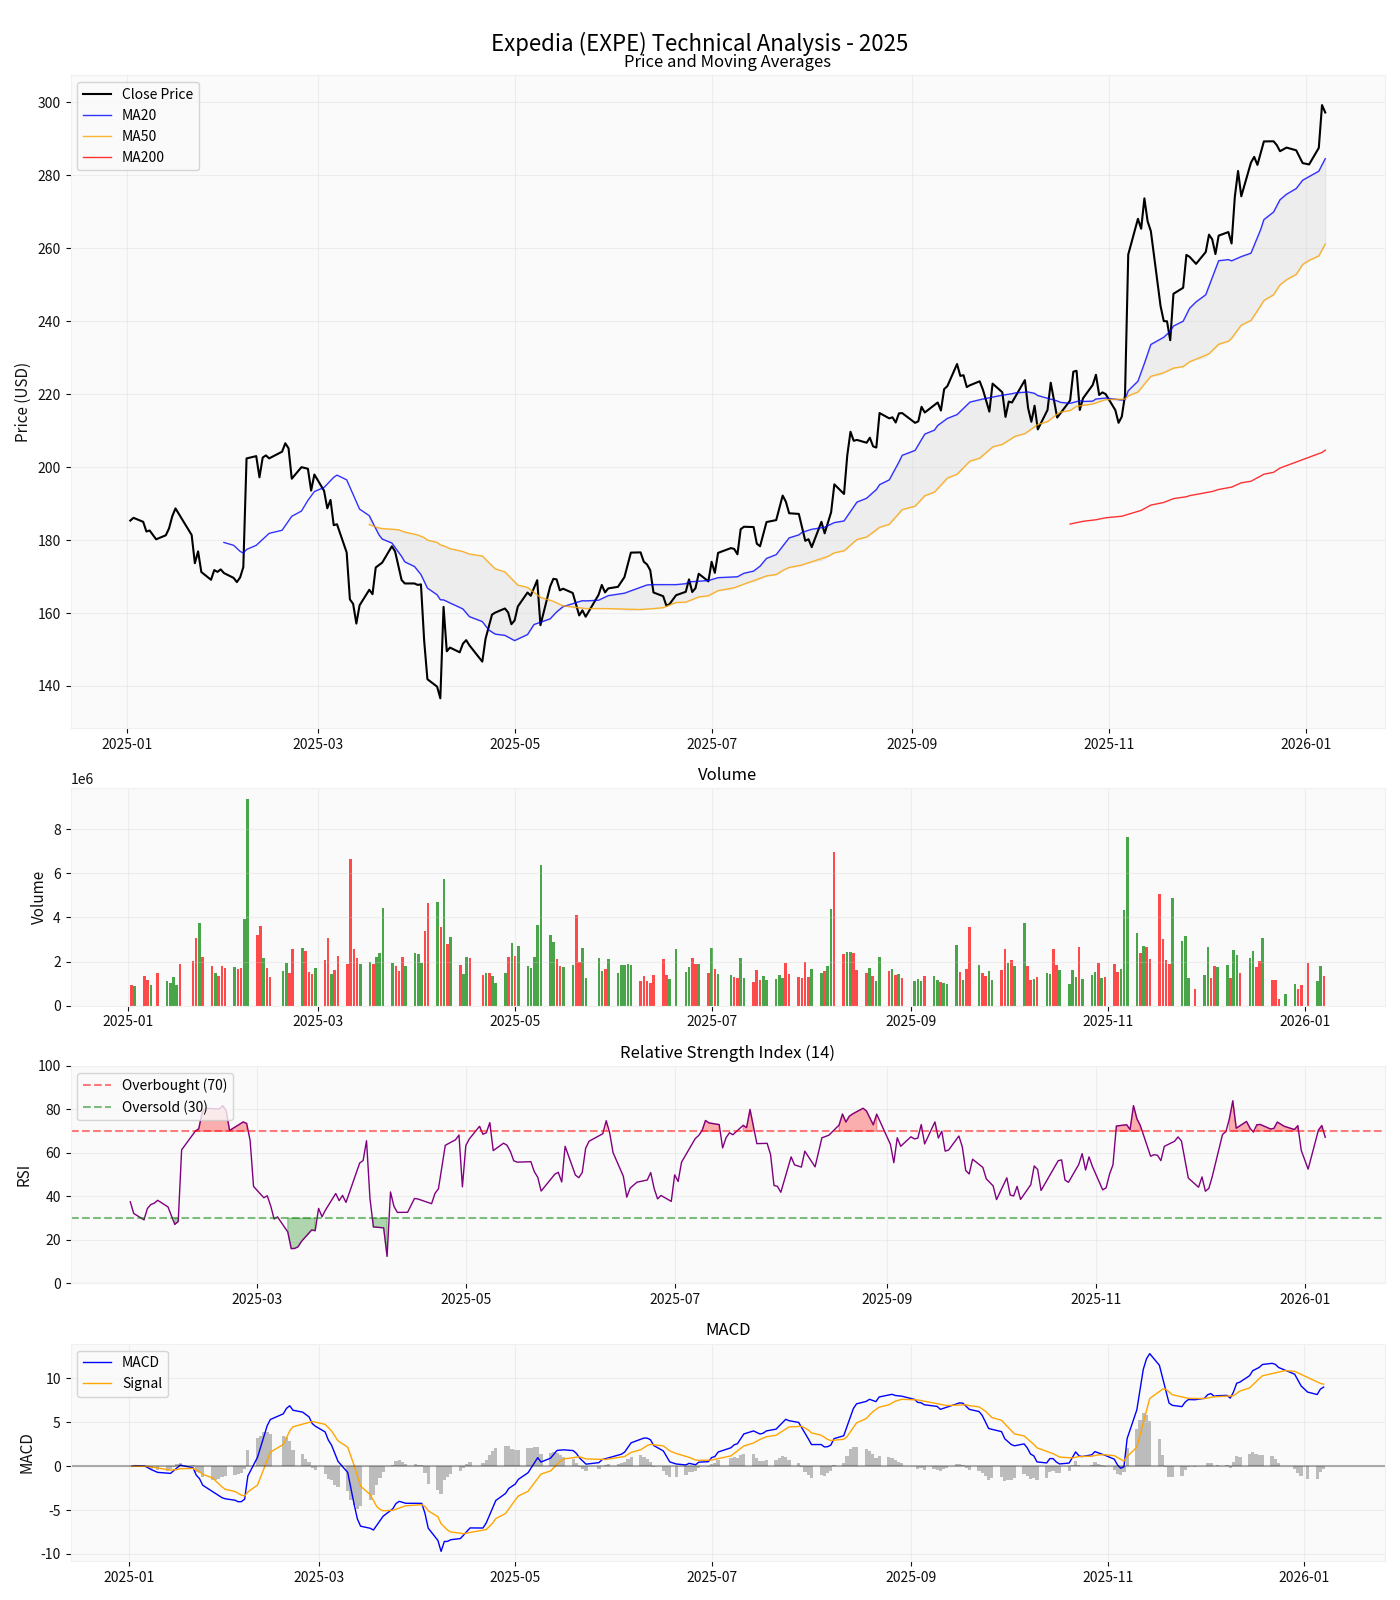
- MA20 (20-Day Moving Average): $284.52 — Price is above the moving average
- MA50 (50-Day Moving Average): $261.10 — Clear upward trend
- MA200 (200-Day Moving Average): $204.62 — Long-term trend is upward
- RSI (14-Day): 67.22 — Approaching overbought territory but not excessive yet
- MACD: 9.01 vs Signal: 9.35 — Slight death cross, short-term correction pressure exists
- KDJ: K=72.2, D=61.9, J=92.8 — Bullish zone
| Level | Price | Description |
|---|---|---|
| Resistance Level | $300.46 | 52-Week High |
| Resistance Level | $310-$320 | Psychological Resistance |
| Support Level | $284.52 | MA20 Moving Average |
| Support Level | $270-$280 | Upper edge of previous consolidation range |
| Support Level | $250 | Key Psychological Support |
- The stock price is near the 52-week high, only 1.1% away from the all-time high
- Short-term overbought signs exist, may face technical correction
- Medium-term upward trend remains unchanged, with MA20 and MA50 providing support
- High Beta (1.43) implies higher volatility
- Phocuswright estimates global travel expenditure will reach approximately $2.2 trillion in 2025
- U.S. travel expenditure is expected to grow 2.2% to $1.2 trillion in 2026
- Both OTA and supplier direct channels continue to grow
-
Uneven Growth
- Slowdown in U.S. market growth, 7% decline in inbound tourism
- Strong rebound in Asia-Pacific market, 60% growth in international bookings for China’s outbound tourism
- International market outperforms North America
-
Changes in Consumer Behavior
- Shortened booking windows, greater emphasis on immediate flexibility
- Shift from refundable to non-refundable rates
- Increased demand for insurance and booking protection products
-
Deepened Loyalty
- Booking’s Genius program and Expedia’s One Key program
- Increased proportion of logged-in users and repeat bookings
- Reduced reliance on paid channels
- Double-digit booking growth in 2025
- Recurring revenue driven by technology platform advantages
- Continued expansion expected in 2026
- Structural growth in the vacation rental market
- Focus on becoming a “trusted vacation rental expert”
- Differentiated competition with Airbnb
- Accelerated investment in markets outside the U.S. in 2024
- Strong brand recognition, growth accelerated after product improvements
- Strong performance in Asian markets
- Established partnerships with OpenAI and others
- Improved customer acquisition efficiency
- Optimized personalized recommendations and search
- Cross-brand point redemption
- Improved customer stickiness and repeat bookings
- Launched in the U.S. and UK
- Economic recession impacting travel spending
- Pressure on consumer disposable income
- Fluctuations in business travel demand
- Booking Holdings continues to dominate the market
- Airbnb expands into the traditional hotel sector
- Google Travel search entry interception
- Slowdown in domestic demand and inbound tourism
- Decline in cross-border inbound tourism (Canada, Europe)
- Risk of high market concentration
- Pressure from rising marketing costs
- Changes in search engine algorithms
- High customer acquisition costs for mobile users
Three scenario analyses based on the DCF model:
| Scenario | Intrinsic Value | Relative to Current Price |
|---|---|---|
| Conservative Scenario | $421.71 | +41.9% |
| Base Scenario | $461.16 | +55.2% |
| Optimistic Scenario | $629.07 | +111.7% |
Probability-Weighted Valuation |
$503.98 |
+69.6% |
| Parameter | Conservative | Base | Optimistic |
|---|---|---|---|
| Revenue Growth Rate | 0% | 27.4% | 30.4% |
| EBITDA Margin | 4.9% | 5.1% | 5.4% |
| Terminal Growth Rate | 2.0% | 2.5% | 3.0% |
| Cost of Equity | 16.0% | 14.5% | 13.0% |
| Cost of Debt | 4.8% | 3.8% | 2.8% |
| WACC | 12.7% | 12.7% | 12.7% |
| Metric | EXPE | Industry Average | Assessment |
|---|---|---|---|
| P/E (TTM) | 26.48x | 25-30x | Reasonable |
| P/S (TTM) | 2.42x | 2-4x | Moderate |
| EV/OCF | 9.01x | 8-12x | Reasonable |
| Market Capitalization | $34.77 Billion | — | Second-Largest OTA |
| Item | Value |
|---|---|
| Consensus Target Price | $256.00 |
| Current Price | $297.18 |
| Potential Decline | -13.9% |
| Target Price Range | $190 - $330 |
| Rating Distribution | Buy 44.6%, Hold 52.7%, Sell 2.7% |
- Bernstein: Market Perform (Maintained), Target Price $256
- BTIG: Buy (Maintained)
- BofA: Buy (Maintained)
- Wedbush: Neutral (Maintained)
- DA Davidson: Neutral (Maintained)
Bernstein maintains a “Market Perform” rating and $256 target price, which is based on:
- Conservative growth expectation assumptions
- Current valuation already fully reflects growth potential
- Valuation discount relative to Booking Holdings
-
Overly Conservative Valuation
- DCF base scenario valuation of $461.16 (+55%)
- Even the conservative scenario has a valuation of $421.71 (+42%)
- $256 corresponds to approximately 18% downside potential
-
Ignoring B2B Business Growth
- Sustained double-digit growth in B2B business
- Contributes stable recurring revenue
- Valuation model fails to fully reflect this
-
Earnings Beat Expectations
- Q3 EPS beat expectations by 8.6%
- Revenue beat expectations by 3%
- Strong growth momentum
-
Technical Overbought Risk
- RSI close to 70, short-term correction needed
- Only 1.1% away from the 52-week high
- May face profit-taking pressure
-
Valuation Multiple Expansion
- Over 60% increase in stock price in 2025
- P/E expanded from 15x to 26x
- Risk of valuation correction exists
-
Headwinds in U.S. Market
- Slowdown in domestic demand
- 7% decline in inbound tourism
- Earnings concentration risk
- Upside Potential:DCF valuation shows 53-112% potential upside
- Downside Risk:Short-term technical overbought may lead to 10-15% correction
- Reasonable Valuation Range:$320-$400 (adjusted based on growth expectations)
- Rating Recommendation:Considering the growth of B2B business, international expansion, and AI technology integration,the current price has medium-term allocation value
-
Strong Growth Momentum
- Leading OTA industry stock performance in 2025 (+60%)
- B2B business becomes a new growth engine
- Improved performance of Vrbo and Hotels.com businesses
-
Reasonable Valuation
- Valuation discount relative to Booking Holdings
- DCF valuation shows significant upside potential
- Growth premium not yet fully reflected
-
Catalysts
- Q4 Earnings Report (February 5, 2026)
- Continued outperformance of B2B business
- Progress in international market expansion
- Breakthroughs in AI technology applications
- Short-term technical correction risk
- Continued weakness in U.S. market demand
- Profit margin pressure from intensified competition
- Macroeconomic downside risk
| Strategy | Recommendation |
|---|---|
| Long-Term Hold | Buy on dips to benefit from B2B and international growth |
| Short-Term Trading | Wait for technical correction to the $270-$280 range |
| Relative Value | More attractive relative to Booking Holdings |
Expedia Group has a solid competitive position in the online travel market, as the second-largest OTA with approximately 16% market share. The company is achieving differentiated competition through B2B business expansion, the One Key loyalty program, and AI technology integration.
In terms of growth prospects, the main drivers are the sustained robust double-digit growth of the B2B business, recovery of the international market, and improved performance of the Vrbo business. Despite short-term headwinds in the U.S. market, the overall growth outlook remains optimistic.
Regarding the $256 target price, we believe this valuation is overly conservative. Based on the DCF model, the company’s intrinsic value ranges from $422 to $629, with a median value of $461 implying a 55% upside from the current price. Although short-term technical adjustment risks exist, the mid-to-long-term allocation value is significant.
[0] Jilin API - Expedia Company Data and Financial Analysis
[1] Porter’s Five Forces Analysis - Expedia Group Competitive Landscape (https://portersfiveforce.com/blogs/competitors/expedia)
[2] SEC EDGAR - Expedia Group 2024 10-K Filing (https://www.sec.gov/Archives/edgar/data/1324424/000132442425000008/expe-20241231.htm)
[3] Protect Group - The Online Travel Agency Landscape Now and Into 2026 (https://www.protect.group/en-us/blog/the-online-travel-agency-landscape-now-and-into-2026)
[4] Fortune - Expedia Group CEO Interview 2026 Outlook (https://fortune.com/2025/12/24/expedia-group-ceo-ariane-gorin-travel-tourism-united-states/)
[5] Yahoo Finance - Travel Demand Outlook 2026 (https://finance.yahoo.com/news/travel-demand-still-rising-2026-151000017.html)
[6] Seeking Alpha - Booking Holdings vs Expedia Competitive Analysis (https://seekingalpha.com/article/4844684-booking-holdings-expedia-and-airbnb-are-back-in-the-game-downgrade)
Insights are generated using AI models and historical data for informational purposes only. They do not constitute investment advice or recommendations. Past performance is not indicative of future results.
About us: Ginlix AI is the AI Investment Copilot powered by real data, bridging advanced AI with professional financial databases to provide verifiable, truth-based answers. Please use the chat box below to ask any financial question.