In-Depth Analysis Report on SailPoint (SAIL) Form 144 Filings
Unlock More Features
Login to access AI-powered analysis, deep research reports and more advanced features

About us: Ginlix AI is the AI Investment Copilot powered by real data, bridging advanced AI with professional financial databases to provide verifiable, truth-based answers. Please use the chat box below to ask any financial question.
Related Stocks
Form 144 is a form required by the U.S. Securities and Exchange Commission (SEC) for insiders when planning to sell company stock. Under the Securities Act of 1933 and SEC Rule 144, insiders (including executives, directors, and affiliates) must file Form 144 when planning to sell more than 5,000 shares of restricted or control stock, or shares with a total value exceeding $50,000, within a three-month period [1][2].
The core purpose of Form 144 is to ensure information transparency and protect investor interests. The filing must be submitted simultaneously with the actual sale order, and it includes key information such as the number of shares planned to be sold, estimated selling price range, stock source, and vesting date [3].
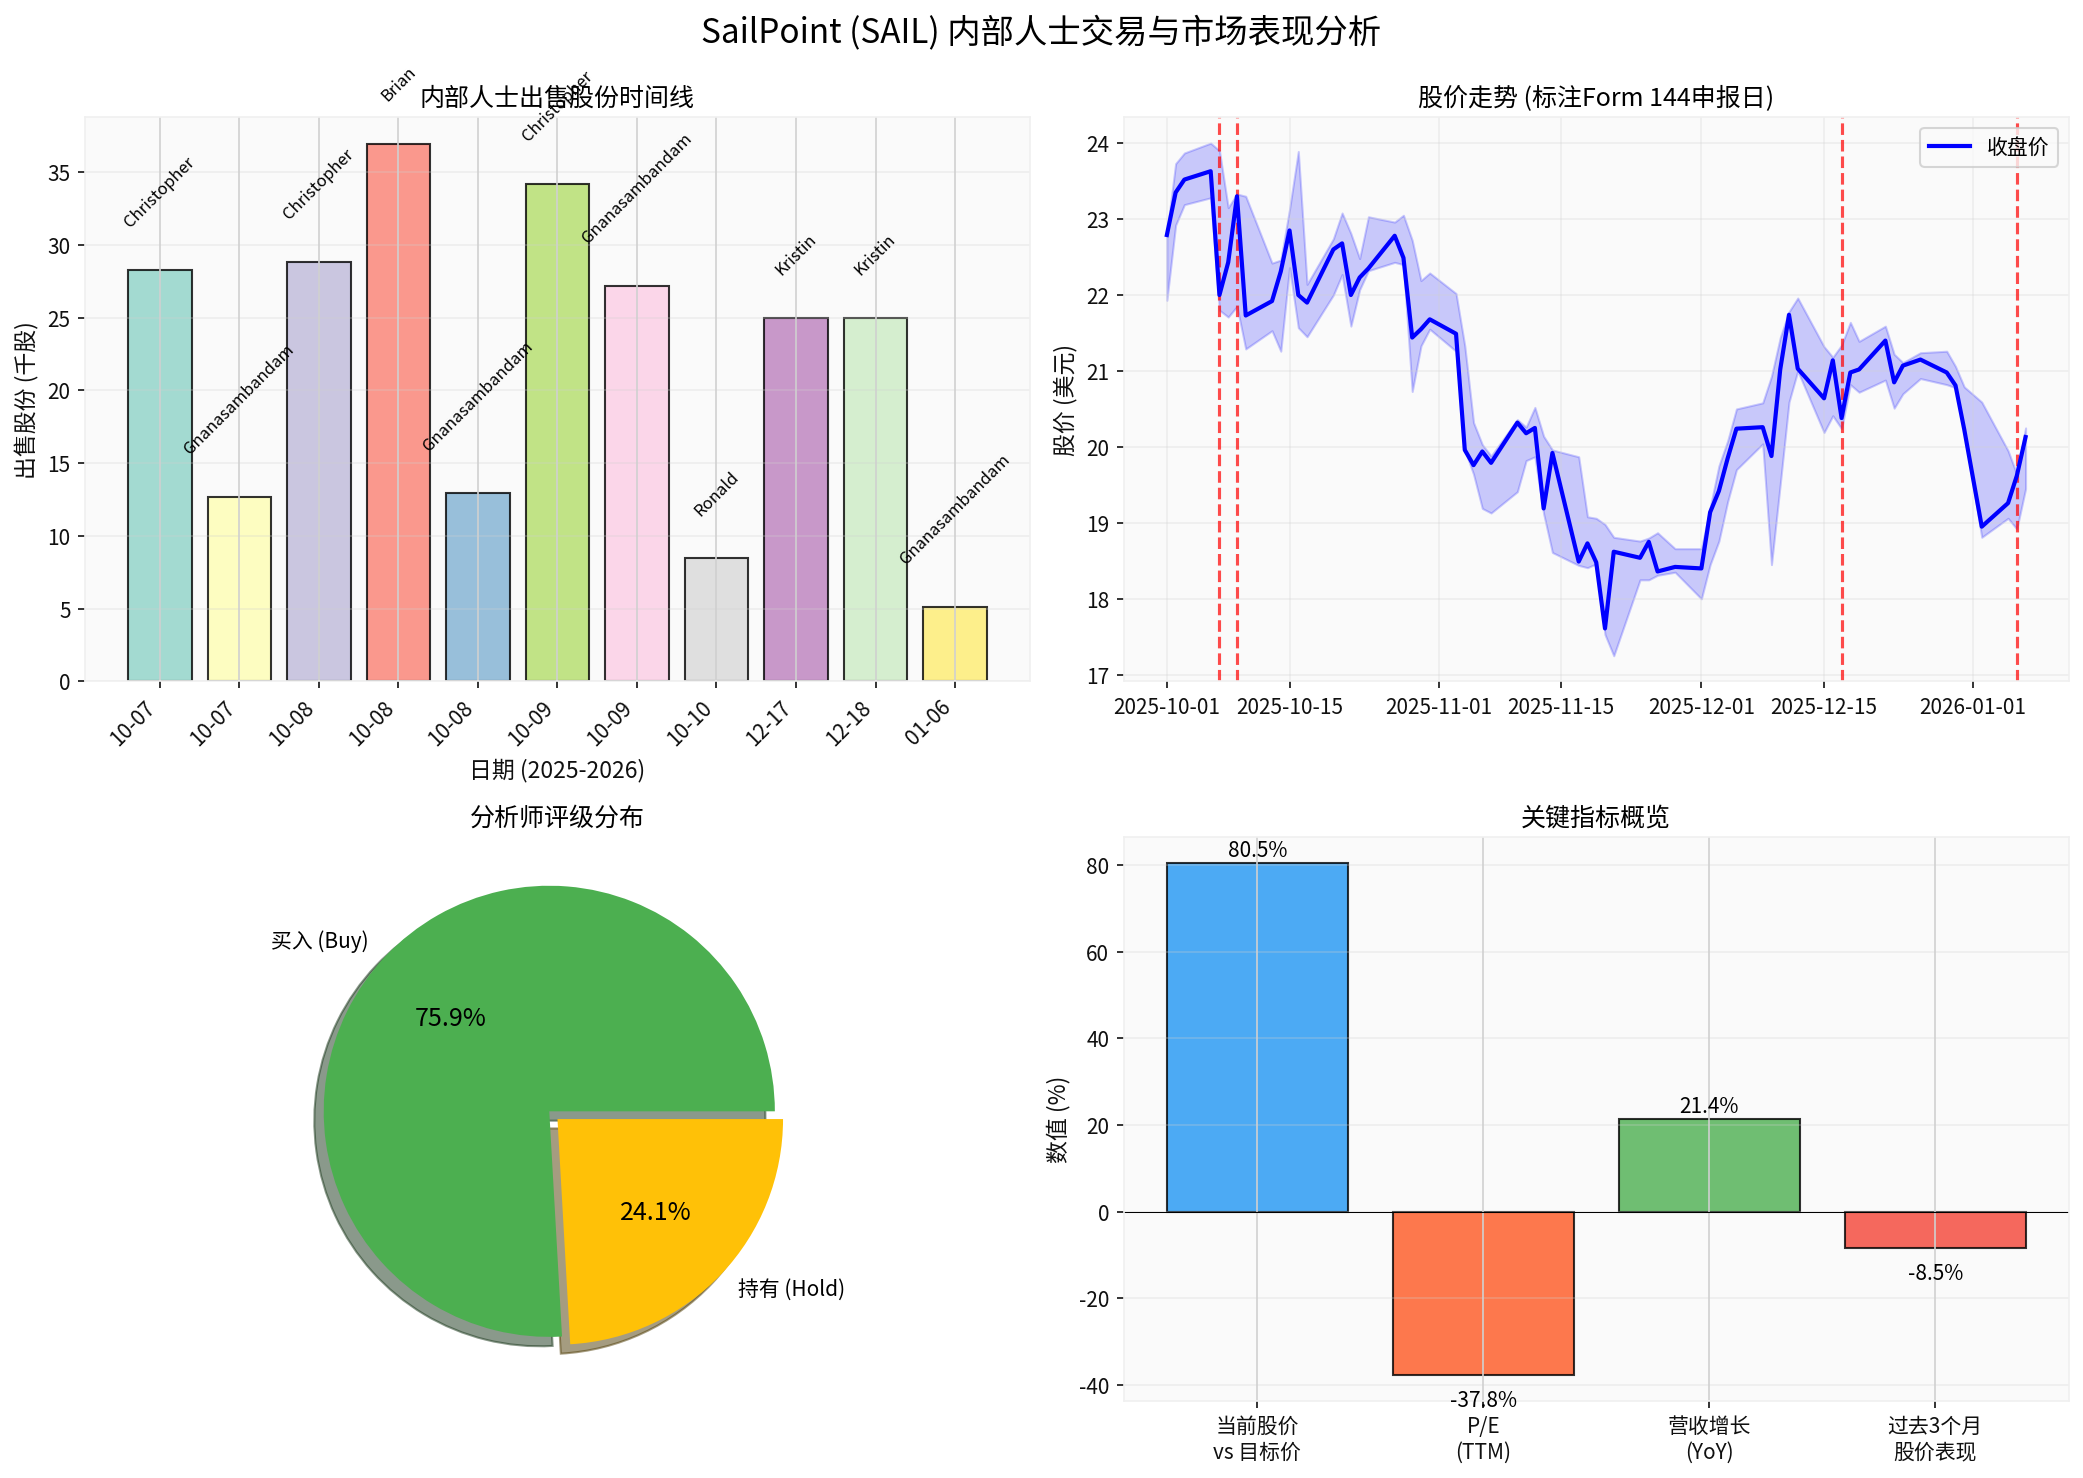
According to public SEC filings, SailPoint, Inc. submitted multiple Form 144 filings on January 6, 2026 [4], involving several current and former executives of the company:
| Filer | Position/Relationship | Planned Shares to Sell | Estimated Value | Sale Date |
|---|---|---|---|---|
Gnanasambandam Chandrasekar |
Executive | 5,124 shares | $98,539 | 2026-01-06 |
Kristin Weston |
Former Director | 25,000 shares | $537,500 | 2025-12-18 |
Kristin Weston |
Former Director | 25,000 shares | $529,822 | 2025-12-17 |
Christopher Schmitt |
Chief Legal Officer & Secretary | 28,841 shares | $647,398 | 2025-10-08 |
Christopher Schmitt |
Chief Legal Officer & Secretary | 28,267 shares | $637,524 | 2025-10-07 |
Ronald J. Green |
Director | 8,450 shares | $184,539 | 2025-10-10 |
Brian Carolan |
Executive | 36,899 shares | $828,289 | 2025-10-08 |
- October 7, 2025: Sold 12,654 shares, generating proceeds of $285,394
- October 8, 2025: Sold 12,911 shares, generating proceeds of $289,810
- October 9, 2025: Sold 27,174 shares, generating proceeds of $609,338
- January 6, 2026: Plans to sell 5,124 shares (from RSU vesting)
From a technical analysis perspective, Form 144 filings show a certain correlation with stock price trends [0]:
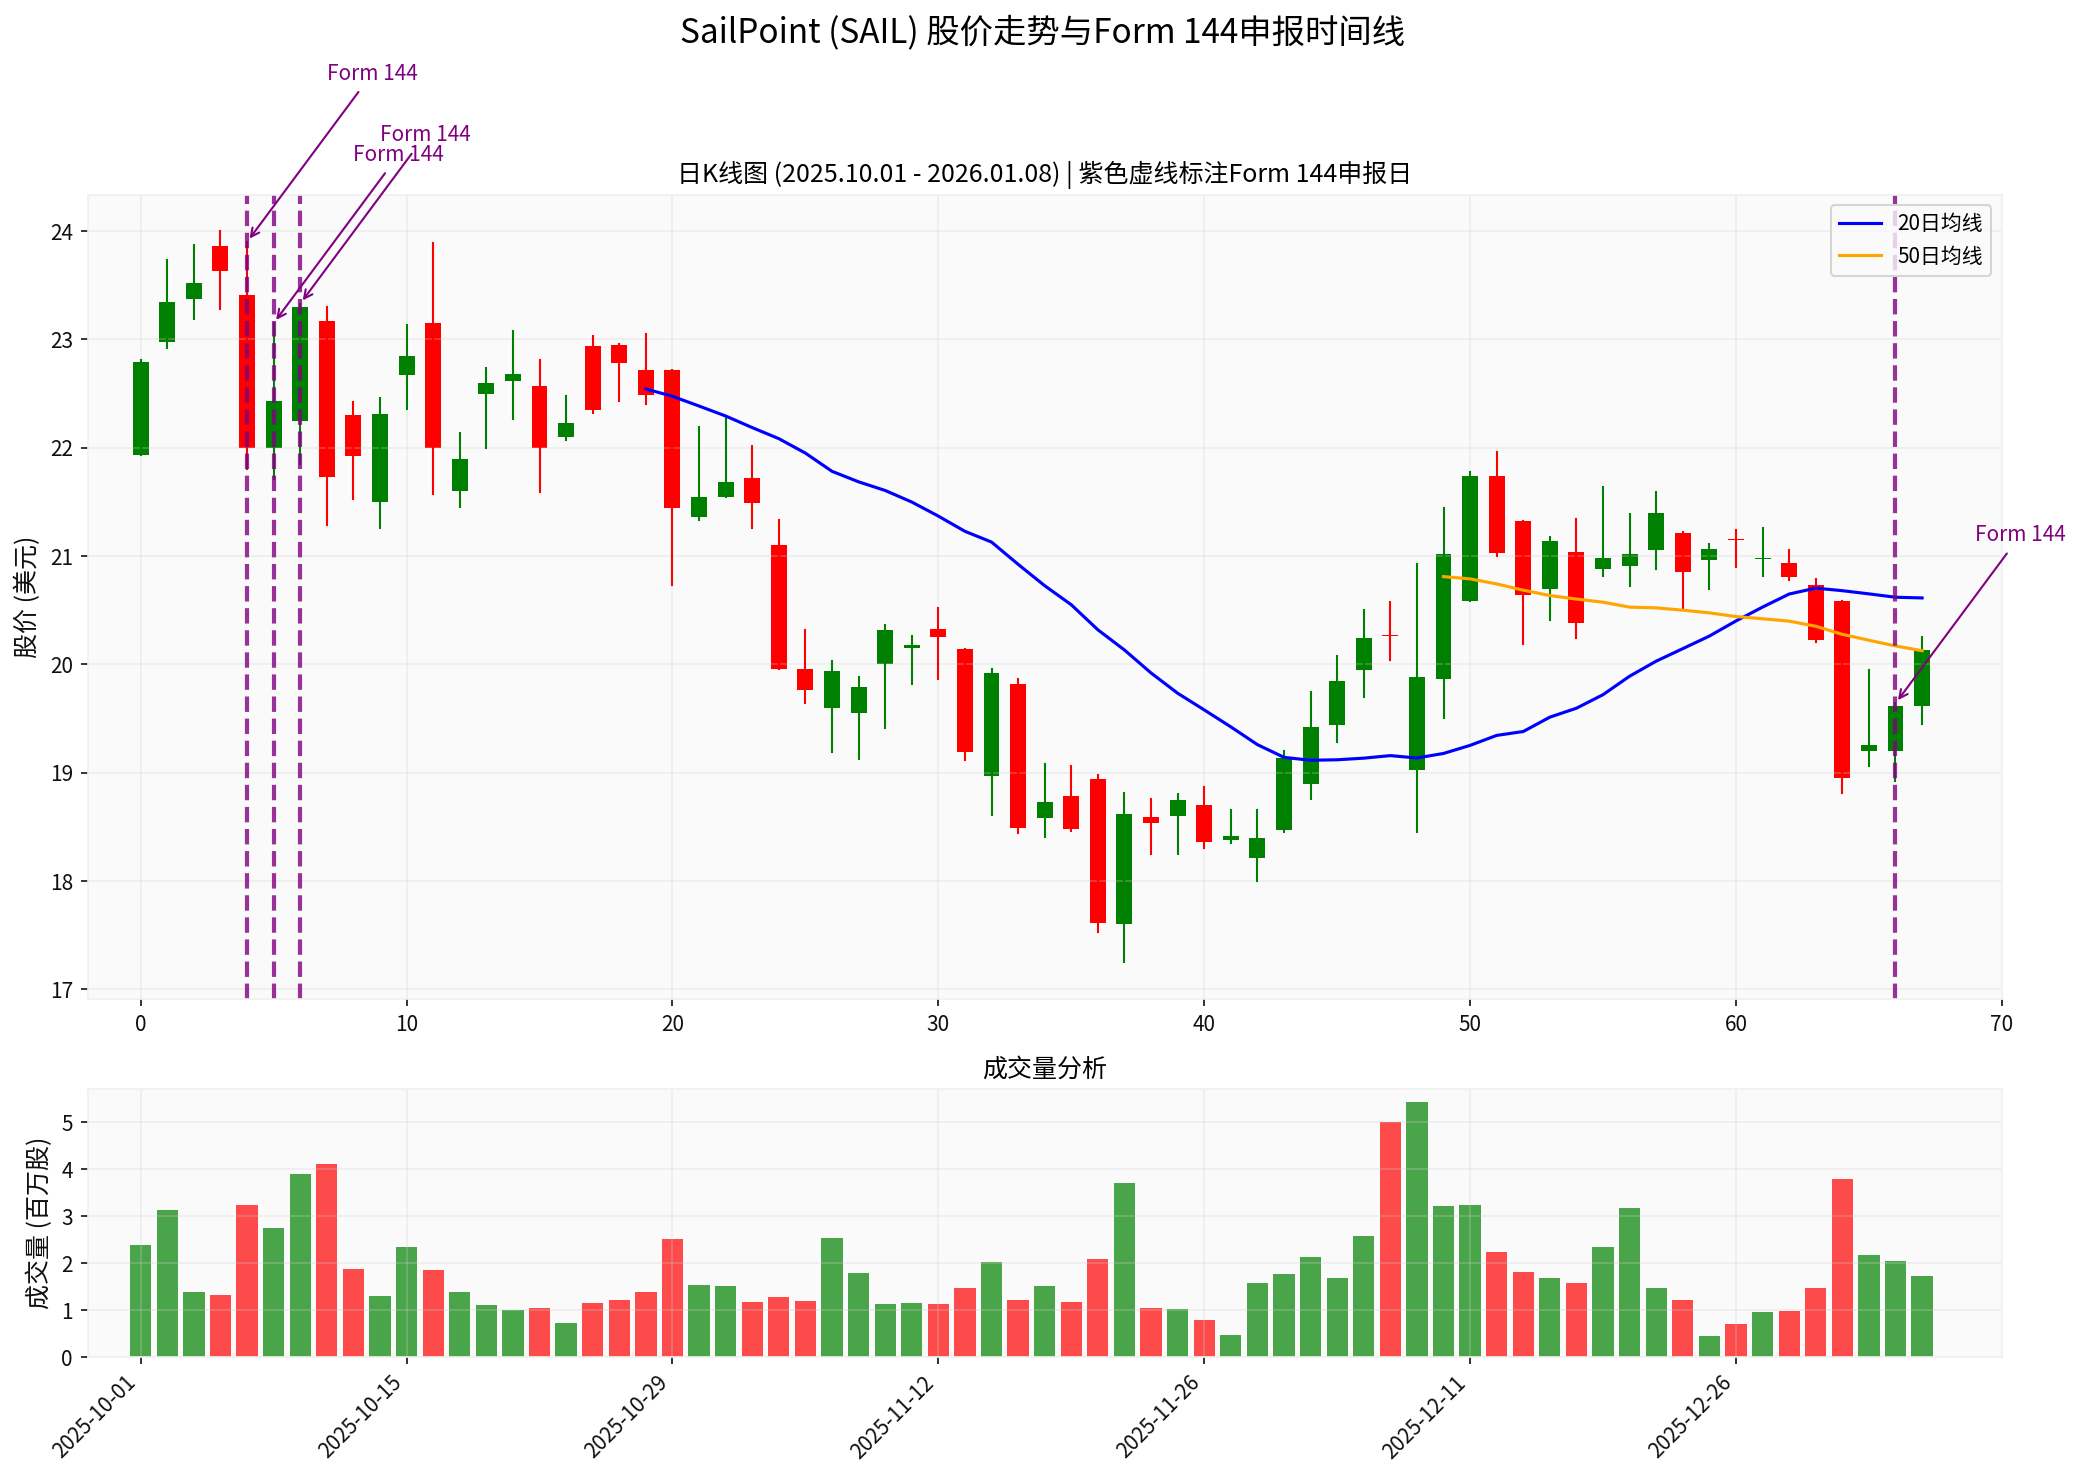
| Time Period | Stock Price Performance | Event Correlation |
|---|---|---|
| Early October 2025 | Stock price hit a periodic high of $24.00 | Period of multiple executives’ Form 144 filings |
| October 7-9, 2025 | Continuous decline with a cumulative drop of approximately 6% | Period of intensive large-scale insider selling |
| December 2025 | Stock price pulled back to $21.19-21.50 | Sale by Former Director Kristin Weston |
| January 2026 | Stock price fell to $20.13 | Stock price has fallen approximately 16% from its 52-week high |
Based on the latest technical analysis indicators [0]:
- Trend Judgment: Sideways trading, no clear trend direction
- Support Level: $19.69
- Resistance Level: $20.61
- Reference Trading Range: $19.69 - $20.61
- 20-Day Moving Average: $20.61 (current price is slightly below this average)
- 50-Day Moving Average: $20.13 (basically flat with the current price)
The MACD indicator shows no crossover signal, with an overall bearish bias; the K value in the KDJ indicator is 35.2, indicating a potential rebound opportunity in the oversold zone; the RSI is in the normal range.
-
Routine Equity Incentive Liquidation: Most Form 144 filings stem from RSU vesting and option exercises, which are normal components of employee compensation plans, rather than a negative judgment on the company [1][2].
-
Transparency of the Pre-Filing System: Form 144 requires advance disclosure of sale plans, which is precisely to prevent “rat trading” and allow the market sufficient time to digest information.
-
Diversified Selling Strategy: Insiders typically use batch selling to reduce market impact, such as Chandrasekar’s batch selling model.
-
Tax Planning Considerations: Year-end sales may be related to tax planning needs and do not necessarily reflect judgments on the company’s prospects.
-
Sale Intensity and Timing: If insiders sell concentratedly at stock price highs, it may indicate an expectation of a short-term stock price peak.
-
Sale Proportion vs. Shareholding Proportion: Large-scale sales relative to total shareholdings may reflect insiders’ liquidity needs or a re-evaluation of valuation.
-
Continuous Filing Pattern: For example, Chandrasekar has sold consecutively over three months, with cumulative proceeds exceeding 52,000 shares (approximately $1.18 million); investors should pay attention to the trend of his shareholding changes.
-
Management Change Signal: Former Director Kristin Weston sold her shares in December, which may reflect changes in corporate governance.
| Indicator Category | Value | Assessment |
|---|---|---|
| Market Capitalization | $11.3 Billion | Large Software Company |
| Current Stock Price | $20.13 | - |
| Consensus Target Price | $25.00 | Upside Potential +24.2% |
| Analyst Rating | 75.9% Buy | Bullish Bias |
| P/E (TTM) | -37.79x | Loss-Making (Growth Stock Trait) |
| Revenue Growth (Latest Quarter) | ~21% YoY | Strong Growth |
| Latest EPS | $0.08 | 33% Above Expectations |
| Investor Type | Recommended Strategy | Rationale |
|---|---|---|
Long-Term Investors |
Hold existing positions or accumulate on dips | Strong revenue growth, bullish analyst consensus, 24% upside potential from target price |
Short-Term Traders |
Focus on support level $19.69 | Sideways technical trading, wait for trend direction |
Risk-Management Focused Investors |
Set stop-loss below $19.00 | Guard against downside risk from sustained insider selling pressure |
Onlookers |
Enter after stock price breaks through resistance level $20.61 | No clear trend direction currently |
- Continuous insider selling may increase short-term selling pressure
- Stock price has fallen approximately 16% from its 52-week high
- Negative P/E indicates the company is still in a loss-making state
- Sustained revenue growth (latest quarter exceeded expectations)
- 75.9% of analysts have given a Buy rating
- Next earnings report will be released on March 19, 2026
SailPoint’s Form 144 filings reflect routine stock selling activities by the company’s insiders (including executives and directors), mainly stemming from the vesting of Restricted Stock Units (RSUs) and option exercises. These filings are a manifestation of SEC transparency rules and should not be automatically interpreted as negative signals.
-
Normal Phenomenon: Form 144 filings are common among public companies, especially technology companies with mature equity incentive plans.
-
Limited Short-Term Impact: Historical data shows that although the stock price fluctuates during the Form 144 filing period, no trend-based decline has occurred.
-
Long-Term Value Remains Unchanged: The company’s fundamentals remain solid, with strong revenue growth, and analysts are generally bullish.
-
Monitor Subsequent Developments: Investors should continue to monitor changes in insider trading patterns and the performance of the upcoming earnings report to be released on March 19, 2026.
[1] Investopedia - SEC Form 144 Explained (https://www.investopedia.com/terms/f/form144.asp)
[2] DFIN - What is a Form 144 SEC Filing? (https://www.dfinsolutions.com/knowledge-hub/knowledge-resources/what-is-form-144-filing)
[3] SEC Investor.gov - Form 144 Glossary (https://www.investor.gov/introduction-investing/investing-basics/glossary/form-144)
[4] SEC.gov - SailPoint, Inc. Form 144 Filings (https://www.sec.gov/Archives/edgar/data/2030781/)
[5] Investing.com - Form 144 SailPoint Filings (https://www.investing.com/news/filings/form-144-sailpoint-for-6-january-93CH-4433806)
[6] Finviz - SailPoint SEC Filings & Insider Trading (https://finviz.com/quote.ashx?t=SAIL&ty=lf)
Insights are generated using AI models and historical data for informational purposes only. They do not constitute investment advice or recommendations. Past performance is not indicative of future results.
About us: Ginlix AI is the AI Investment Copilot powered by real data, bridging advanced AI with professional financial databases to provide verifiable, truth-based answers. Please use the chat box below to ask any financial question.