Analysis of the Shanghai Composite Index's Record 14 Consecutive Up Days Rally
Unlock More Features
Login to access AI-powered analysis, deep research reports and more advanced features

About us: Ginlix AI is the AI Investment Copilot powered by real data, bridging advanced AI with professional financial databases to provide verifiable, truth-based answers. Please use the chat box below to ask any financial question.
Related Stocks
Based on the above data analysis, I now provide you with a complete analysis report:
The Shanghai Composite Index achieved
| Indicator | Value |
|---|---|
| Number of Consecutive Up Days | 14 days (Record High) |
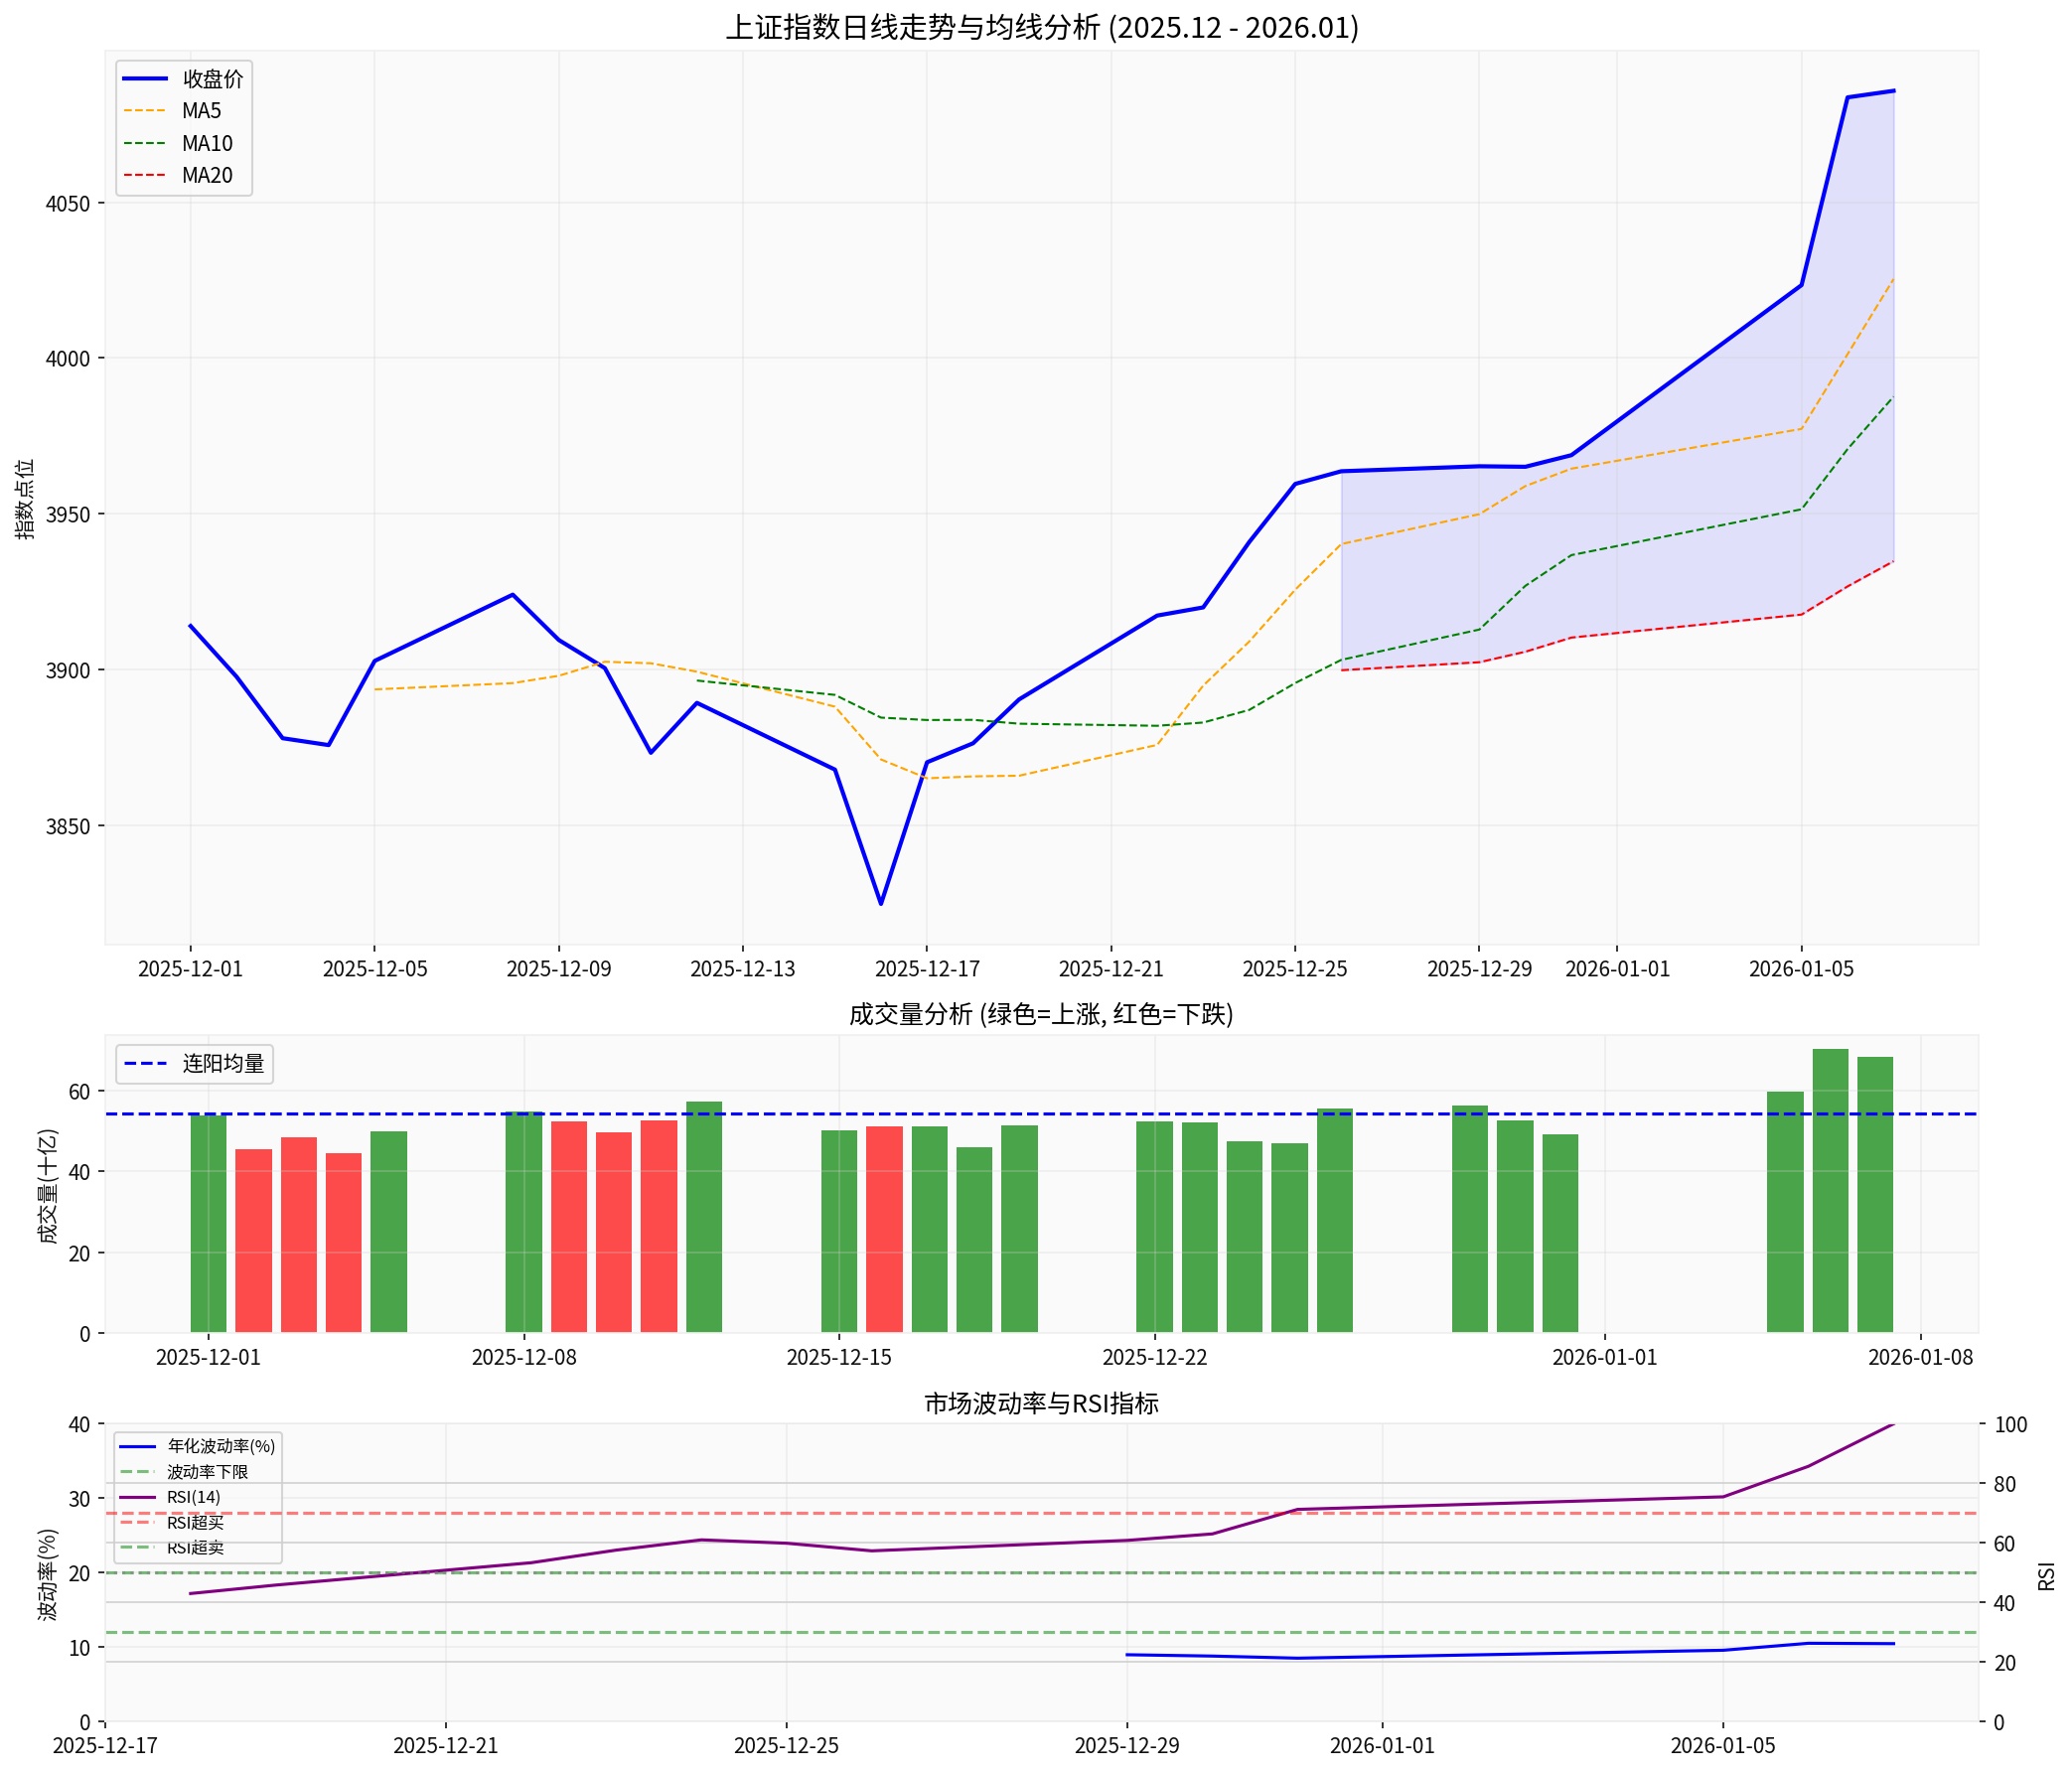
| Closing Price | 4085.77 points |
| Intraday High | 4098.78 points (approaching 4100 points) |
| Cumulative Gain During the Period | +5.57% |
| Total Turnover | 2.85 trillion yuan (exceeding 2.8 trillion yuan for 2 consecutive days) |
| Stock | Gain | Remarks |
|---|---|---|
| Nanda Optoelectronics | 20% daily limit | Leading photoresist stock |
| Xinyuan Micro | 20% daily limit | Closing price: 190.79 yuan |
| AMEC | +6.88% | Intraday record high of 358.90 yuan |
| NAURA Technology | +6.32% | Stock price hit a record high |
- Zheshang Securities: AI-driven memory super cycle, the global semiconductor market is expected to grow 9% to US$760.7 billion in 2026 [2]
- Domestic wafer fabs have seen a rebound in capacity utilization and strong willingness to expand production
- Main capital inflow into the photoresist sector reached 2.838 billion yuan
- “The central level of coal prices has risen significantly during the 14th Five-Year Plan period”
- “A new cycle is expected during the 15th Five-Year Plan period”
- Dividend yields of leading coal companies are mostly 4%-6%, with obvious valuation advantages
- After the pessimistic expectations of coal prices are reversed, valuation elasticity is expected to emerge
| Indicator | Value | Signal Judgment |
|---|---|---|
| RSI(14) | 99.94 |
⚠️ Severe Overbought Zone |
| MA5 | 4025.36 | ✓ Short-term Trend Upward |
| MA10 | 3987.63 | ✓ Short-term Trend Upward |
| MA20 | 3934.81 | ✓ Medium-term Trend Upward |
| Annualized Volatility | 10.48% |
✓ Moderate Volatility |
| Volume Change | +26.0% |
⚠️ Risk of Volume-Price Divergence |
-
Severe RSI Overbought: The RSI value is close to 100, indicating the market is in an extreme overbought state. Historical experience shows that pullback pressure often follows continuous sharp rises [0]
-
Bullish Alignment of Moving Averages: Short-term moving averages are running above long-term moving averages, indicating the medium-term trend remains upward
-
Volume Expansion with Hidden Risks: The latest trading volume is 26% higher than the average during the consecutive up days. While this shows active capital, it is necessary to be alert to the volume-price divergence phenomenon of “expanded volume but stagnant growth”
| Indicator | Value | YoY Change |
|---|---|---|
| Annual New Accounts | 27.4369 million |
+9.75% |
| December Single Month | Approximately 2.6 million | +30.55% |
The number of new accounts opened in 2025 hit a new high since 2022, indicating continuous inflow of off-exchange funds [1].
| Institution | Shanghai Composite Index Target | CSI 300 Target | Potential Gain |
|---|---|---|---|
| Goldman Sachs | - | 5200 points | +12% |
| JPMorgan Chase | - | 5200 points | +12% |
| HSBC | 4500 points | 5400 points | +13%-16% |
-
Fundamental Improvement:
- Corporate profit expectations are positive, and institutions generally predict earnings growth in 2026
- The global semiconductor industry is in an upward cycle, and the technology sector has performance support
-
Adequate Liquidity:
- New account openings hit a new high, with incremental funds continuing to flow in
- The total turnover of the two markets has exceeded 2.8 trillion yuan for consecutive days, with high capital activity
-
Policy Support Expectations:
- Expectations of loose monetary policy
- Proactive fiscal policy
-
Relatively Reasonable Valuation:
- Compared with historical highs, valuations are still in a reasonable range
- Dividend yields of cyclical stocks such as coal are attractive
- Technical Overbought: RSI is close to 100, with pullback demand
- Volume-Price Divergence: Volume expanded on the last day but the gain was only 0.05%, requiring vigilance
- External Market Volatility: U.S. stocks have been volatile recently (S&P 500 fell 0.18% in the past 10 days)
- Sector Rotation Risk: More individual stocks fell than rose (over 3,100 individual stocks fell in the entire market)
- Risk Warning: Technical indicators show severe overbought conditions, suggesting moderate position control
- Signals to Watch: Changes in trading volume, whether it breaks below the 5-day moving average
- Trend Judgment: The medium-term trend is still promising, and pullbacks are good opportunities to add positions
- Allocation Recommendations:
- Technology Growth: Semiconductor equipment, photoresist (AI-driven)
- Cyclical Value: Coal (high dividend + cyclical recovery)
- Earnings Certainty: Earnings pre-increase sectors
- Semiconductor Equipment: Domestic substitution + AI demand resonance
- Coal: High dividend + stable and rising coal prices
- Commercial Space/Controllable Nuclear Fusion: Emerging theme investment
The Shanghai Composite Index’s 14 consecutive up days is the first since 1992.
Operational Recommendations:
[1] Investing.com - “Shanghai Composite Index’s 14 Consecutive Up Days Sets Longest Record! A-Shares New Account Openings Exceed 27.43 Million in 2025” (https://cn.investing.com/news/stock-market-news/article-3154761)
[2] Eastmoney - “Today, Shanghai Composite Index Hits 14 Consecutive Up Days! Semiconductor Equipment Sectors Surge, Multiple Leading Stocks Hit Record Highs” (https://finance.eastmoney.com/a/202601073611459050.html)
[3] China News Service Jingwei - “Shanghai Composite Index’s 14 Consecutive Up Days, Photoresist Concept Triggers Daily Limit Surge” (https://cj.sina.cn/articles/view/5993531560/1653e08a802001jmzq)
[0] Gilin API Market Data
Insights are generated using AI models and historical data for informational purposes only. They do not constitute investment advice or recommendations. Past performance is not indicative of future results.
About us: Ginlix AI is the AI Investment Copilot powered by real data, bridging advanced AI with professional financial databases to provide verifiable, truth-based answers. Please use the chat box below to ask any financial question.