Analysis of the Silver Market and Investment Value of Xingye Mining
Unlock More Features
Login to access AI-powered analysis, deep research reports and more advanced features
About us: Ginlix AI is the AI Investment Copilot powered by real data, bridging advanced AI with professional financial databases to provide verifiable, truth-based answers. Please use the chat box below to ask any financial question.
Related Stocks
Based on market data analysis and company research, the following is a comprehensive analysis report on silver price trends and the investment value of Xingye Mining.
Silver prices indeed experienced extreme volatility in 2025. According to historical data, silver futures prices hit a high of
However, since mid-2025, silver prices have pulled back sharply:
| Indicator | Value |
|---|---|
| Current Price | $36.40/oz |
| 6-Month High | $82.67/oz |
| 6-Month Low | $29.23/oz |
| 6-Month Decline | -42.76% |
| 20-Day Moving Average | $37.97 |
| 50-Day Moving Average | $38.51 |
| RSI(14) | 24.69 (Oversold Zone) |
Current silver prices have fallen below major moving averages, and the RSI is in the oversold zone of 24.69, indicating technical rebound potential [0].
- Spillover of global central bank gold buying frenzy to the silver market
- Strengthened industrial demand expectations, especially in the photovoltaic industry
- Safe-haven demand amid heightened geopolitical risks
- Weakening U.S. dollar index supporting commodity prices
- Rising expectations of Fed rate hikes boosting the U.S. dollar
- Growing concerns over industrial metal demand
- Profit-taking pressure release
- Overall pullback in commodities such as crude oil
Silver has unique dual attributes as a precious metal and an industrial metal, with industrial demand accounting for approximately 50% of total demand, mainly used in the following areas:
| Application Area | Proportion | Use Case |
|---|---|---|
| Photovoltaic | ~30% | Silver paste for solar panels |
| Electronics & Electricals | ~20% | Contacts, solders, conductive pastes |
| Jewelry & Ornaments | ~20% | Decorative materials |
| Investment Demand | ~15% | Gold and silver bars, ETFs |
| Others | ~15% | Chemical industry, mirror coatings, etc. |
The photovoltaic industry is the core growth driver of industrial silver demand. According to industry data:
- PERC Cells: Approximately 3-4 tons of silver consumed per GW
- TOPCon Cells: Approximately 4-5 tons of silver consumed per GW
- HJT Cells: Approximately 8-10 tons of silver consumed per GW
With the increasing penetration of N-type cells (TOPCon, HJT), silver consumption per GW will increase significantly. China’s new photovoltaic installed capacity continues to lead the world, providing solid support for industrial silver demand.
In addition to photovoltaics, silver applications in the following areas also deserve attention:
- Electric Vehicles: Silver consumption per vehicle is approximately 25-50 grams, growing with the penetration rate of new energy vehicles
- 5G Communications: Base station construction requires a large amount of silver paste and conductive materials
- Renewable Energy Infrastructure: Energy storage, charging piles, etc.
| Indicator | Value |
|---|---|
| Stock Code | 000426.SZ |
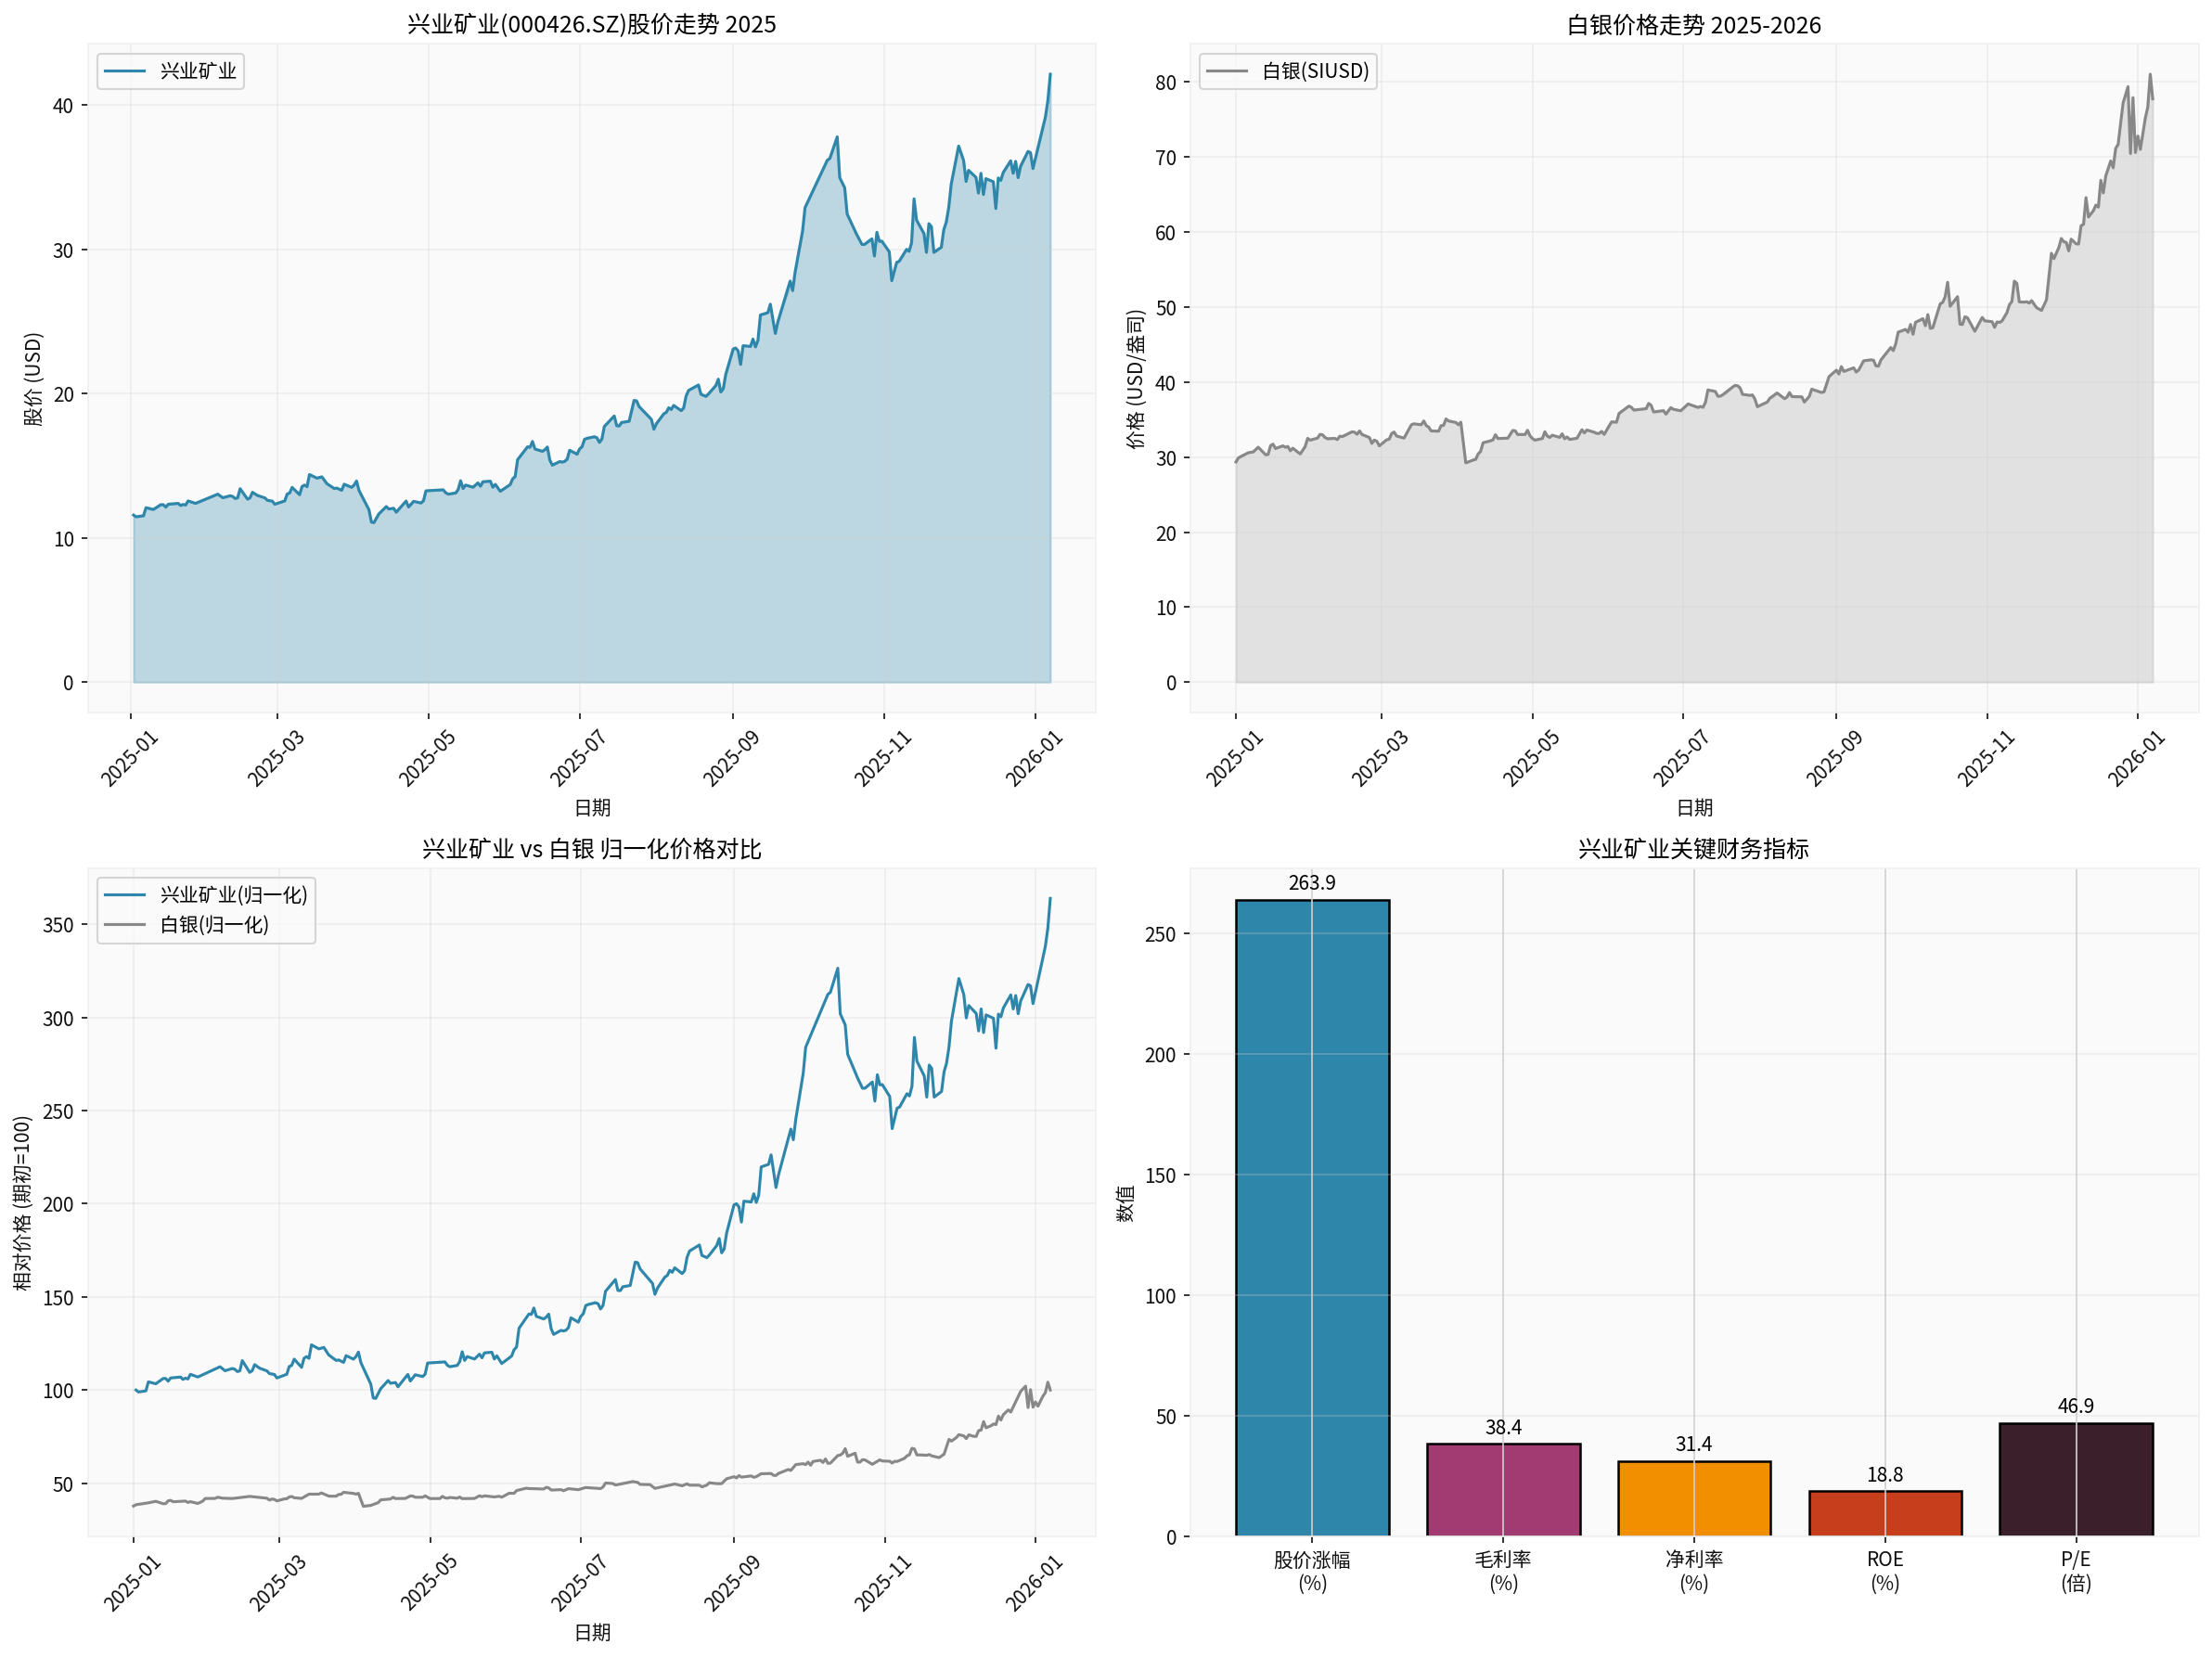
| Latest Stock Price | $42.14 |
| Market Capitalization | $74.83B |
| 52-Week Range | $10.05 - $43.95 |
| P/E (TTM) | 46.94x |
| P/B (TTM) | 8.17x |
| EPS (TTM) | $0.90 |
Xingye Mining delivered outstanding financial results in 2025:
| Financial Indicator | Value | Industry Comparison |
|---|---|---|
| Gross Margin | 38.39% | Above industry average |
| Net Profit Margin | 31.42% | Excellent |
| ROE | 18.80% | Good |
| Current Ratio | 0.51 | Need attention |
| Quick Ratio | 0.41 | Need attention |
| Reporting Period | EPS | Revenue |
|---|---|---|
| Q3 2025 | $0.32 | $1.63B |
| Q2 2025 | $0.24 | $1.32B |
| Q1 2025 | $0.21 | $1.15B |
| Q4 2024 | $0.13 | $0.97B |
The company’s performance shows a sustained growth trend, with both revenue and profit achieving substantial year-on-year increases [0].
A DCF (Discounted Cash Flow) model is used for valuation analysis:
| Scenario | Valuation | Upside from Current Price |
|---|---|---|
| Conservative Scenario | $81.47 | +93.3% |
| Base Scenario | $93.79 | +122.6% |
| Optimistic Scenario | $142.30 | +237.7% |
| Probability-Weighted | $105.85 | +151.2% |
DCF analysis shows that even under conservative assumptions, Xingye Mining still has significant valuation repair potential [0].
| Technical Indicator | Status | Interpretation |
|---|---|---|
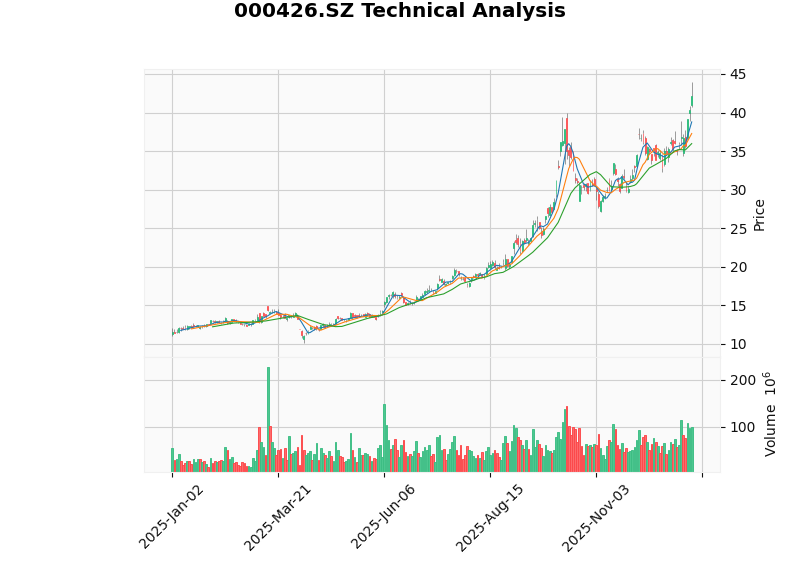
| MACD | Bullish Crossover | Sustained upward momentum |
| KDJ | Golden Cross | Short-term bullish |
| RSI | Overbought Risk | Need to watch for pullback |
| Trend | Uptrend | Effective breakout |
- Support Level: $37.28
- Resistance Level: $43.95
- Next Target: $46.09
Technical indicators show the stock price is in a strong uptrend, but there are short-term overbought risks [0].
Through 30-day rolling correlation analysis:
| Indicator | Value |
|---|---|
| Latest Correlation | 0.1909 |
| Average Correlation | 0.3705 |
| Correlation Range | -0.22 ~ 0.66 |
The correlation between Xingye Mining and silver prices is at a
- Stock price does not fully follow silver price fluctuations, with company-specific fundamental factors having a greater impact
- Stock price performance significantly outperforms silver prices: Xingye Mining rose 264% in 2025, while silver fell approximately 10% over the same period
- The company has alpha return capabilities, creating excess value through mine operations, cost control, etc.
| Dimension | Assessment |
|---|---|
| Degree of Benefit from Silver Price Increases | Moderate (stock price has weak correlation with silver price) |
| Degree of Benefit from Photovoltaic Demand Growth | High (leading integrated silver-lead-zinc mining enterprise) |
| Valuation Attractiveness | High (DCF shows 151% upside potential) |
| Technicals | Strong but with overbought risks |
| Fundamentals | Sustained earnings growth, excellent profitability |
- Direct Benefit Path: Growth in photovoltaic silver paste demand → Increase in industrial silver demand → Mid-to-long-term bullish silver prices → Rise in Xingye Mining’s product selling prices
- Indirect Benefit Path: Expansion of new energy industry chain → Growth in demand for metals such as lead and zinc → Increase in the company’s comprehensive mining revenue
- Current Investment Value: The company’s valuation remains attractive, with fundamentals continuing to improve
- Short-term: Wait for the stock price to pull back to the $37-38 range to build positions
- Mid-term: First target price $46, second target price $55
- Long-term: DCF valuation shows a target price above $100 is achievable
| Risk Type | Details |
|---|---|
| Price Risk | Sharp fluctuations in silver prices may affect performance |
| Policy Risk | Adjustments to photovoltaic industry policies affect demand |
| Liquidity Risk | Relatively limited liquidity in Hong Kong Stock Connect/Shenzhen Stock Connect |
| Valuation Risk | The current P/E ratio of 46.94x is at a historical high |
| Operational Risk | Mine work safety, environmental compliance, etc. |
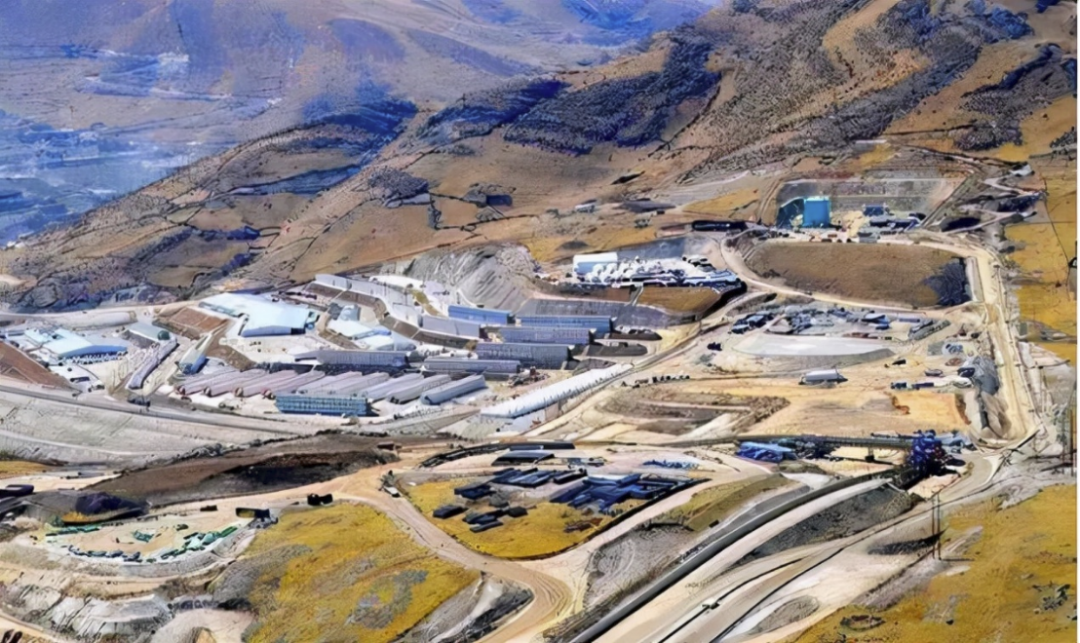
Silver prices experienced a sharp pullback after hitting a 45-year high, and are currently in a technical oversold zone with rebound opportunities. As an important integrated silver-lead-zinc mining enterprise in China, Xingye Mining has strong fundamentals and attractive valuation, and its stock price performance has significantly outperformed silver prices, demonstrating strong alpha return capabilities.
From the perspective of the “dual-drive of photovoltaic and industrial demand”, Xingye Mining has mid-to-long-term investment value, but attention should be paid to:
- Silver price trends and the progress of industrial demand recovery
- The company’s capacity expansion and cost control capabilities
- Valuation digestion and short-term overbought risks
It is recommended that investors accumulate positions on dips and hold for the mid-to-long term to share the dual dividends of new energy industry chain expansion and the precious metal upward cycle.
[0] Jinling AI Financial Database - Real-time Quotes, Financial Data, Technical Analysis, DCF Valuation (Data as of January 7, 2026)
Insights are generated using AI models and historical data for informational purposes only. They do not constitute investment advice or recommendations. Past performance is not indicative of future results.
About us: Ginlix AI is the AI Investment Copilot powered by real data, bridging advanced AI with professional financial databases to provide verifiable, truth-based answers. Please use the chat box below to ask any financial question.