In-Depth Analysis of the Impact of Plummeting Silver Inventories on Profitability of Mining Enterprises Including Xingye Silver-Tin
Unlock More Features
Login to access AI-powered analysis, deep research reports and more advanced features
About us: Ginlix AI is the AI Investment Copilot powered by real data, bridging advanced AI with professional financial databases to provide verifiable, truth-based answers. Please use the chat box below to ask any financial question.
Related Stocks
Based on the collected data and materials, I will prepare a detailed analysis report for you.
A significant inventory contraction has recently emerged in the silver market, a trend that is profoundly impacting the supply and demand dynamics of the precious metals market. According to the latest data [1][2]:
| Indicator | Historical Peak | Current Level | Decline |
|---|---|---|---|
| LBMA Silver Inventories | 36,700 tonnes (2022) | 27,200 tonnes | 25.9% |
| SHFE Silver Inventories | 3,075.53 tonnes | 780.6 tonnes | 75% |
| Yinman Mining Annual Production Capacity | - | 6,000 tonnes | - |
- Silver inventories held by the London Bullion Market Association (LBMA) fell from 31,000 tonnes in 2022 to 22,000 tonnes in March 2025, representing a 30%decline [1]
- Domestically, as of the end of November 2025, SHFE silver inventories fell below 446 tonnes, hitting a new low since 2016 [1]
- As of December 11, 2025, SHFE silver inventories stood at only 780.6 tonnes, plummeting nearly75%from their historical peak of 3,075.53 tonnes [2]
The silver market is experiencing a structural imbalance between supply and demand, which is the root cause of the sustained inventory decline:
- Global silver supply is expected to reach 32,056 tonnesin 2025, representing a marginal year-on-year increase of just 1.5% [1]
- Mine-side supply in the fourth quarter contracted further to 6,887.81 tonnes, down 1.61% from the third quarter
- Production in major producing countries such as Mexico and Peru continues to decline due to insufficient investment and labor issues
- Recycled silver accounts for only 18% of total supply, with no significant room for growth
- Global silver demand is expected to reach 1.12 billion ouncesin 2025, with industrial demand performing strongly and projected to grow 8% [1]
- Applications related to photovoltaics, 5G, and AI account for over 40%of demand
- 2025 is referred to as the “first year of AI industrialization,” and demand for silver in artificial intelligence hardware has surged
- Silver has been in short supply for the fifth consecutive year, and the supply deficit is expected to exceed 2,900 tonnesagain in 2026 [3]
The silver market witnessed a rare bull market rally in 2025:
| Time Node | Price (USD/oz) | Cumulative Gain |
|---|---|---|
| January 2, 2025 | 29.41 | - |
| October 2025 | 50+ | 70%+ |
| November 2025 | 57+ | 94%+ |
| December 2025 | 59+ | 100%+ |
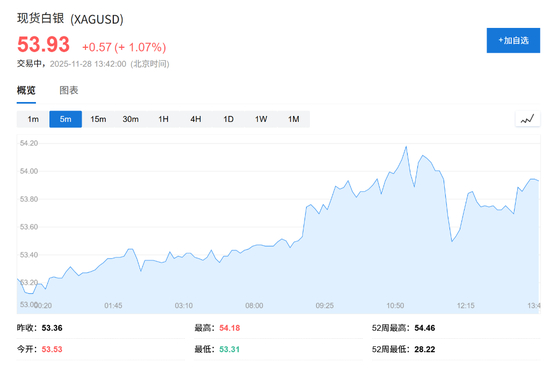
Spot silver prices rose to
Silver-related assets are highly sought after by investors:
- Demand for silver ETFs continues to rebound
- The 1-month silver leasing rate overseas is at a historically high level
- Large amounts of macro financial capital have flooded into the silver market to lock in deliverable resources
| Item | Details |
|---|---|
| Year of Establishment | 1991 (predecessor: Chifeng Jingxin Steel Shot Factory) |
| Listing Time | Backdoor listing on the Shenzhen Stock Exchange in 2011 |
| Major Shareholder | Xingye Group |
| Main Business | Mining, dressing, and smelting of non-ferrous metals such as silver, tin, zinc, and lead |
| Subsidiary Mines | 11 subsidiaries including Yinman Mining, Yubang Mining, Rongguan Mining, and Xilin Mining |
After the company completed the acquisition of
| Mineral | Reserves | Year-on-Year Change | Domestic Ranking |
|---|---|---|---|
| Silver | 27,200 tonnes |
+181% | 1st in Asia, 8th globally |
| Tin | 185,700 tonnes | -3% | 2nd (after Yunnan Tin Co., Ltd.) |
| Zinc | 3,892,600 tonnes | +80% | - |
| Lead | 1,329,200 tonnes | +54% | - |
According to USGS data, as of the end of 2024, China’s proven silver reserves stood at 70,000 tonnes. The company’s silver resources account for
The output of the company’s main products in the first three quarters of 2025 is as follows [5]:
| Product | Output | Year-on-Year Change | Revenue Share |
|---|---|---|---|
| Mine-Produced Silver | 212.16 tonnes | +18.98% | 36.33% (Largest revenue source) |
| Mine-Produced Tin | 5,651.48 tonnes | -13.12% | 33.04% |
| Mine-Produced Zinc | 45,783.81 tonnes | +1.92% | - |
| Mine-Produced Gold | 0.074 tonnes | +221.74% | - |
- The significant growth in silver output is mainly due to the incremental contribution from the consolidation of Yubang Mining at the beginning of the year
- The resumption of production at subsidiary Bosheng Mining in April 2025 drove an increase in gold output
- All tin products are produced at Yinman Mining, which suspended production from March 9 to April 16, 2025 due to an accident [5]
Xingye Silver-Tin’s recent financial data has performed strongly [6]:
- Current Stock Price: RMB 42.14
- Daily Gain: +4.59%
- 52-Week Gain: +248.55%
- 6-Month Gain: +147.74%
- Market Capitalization: RMB 74.83 billion
- P/E Ratio: 46.94x
- ROE: 18.80%
- Net Profit Margin: 31.42%
- Operating Profit Margin: 38.39%
| Indicator | 2025E | 2026E | 2027E |
|---|---|---|---|
| Operating Revenue (RMB 100 million) | 52.31 | 62.73 | 70.00 |
| Year-on-Year Growth Rate | 22.5% | 19.9% | 11.6% |
| Net Profit Attributable to Shareholders (RMB 100 million) | 20.15 | 25.63 | 29.14 |
| Year-on-Year Growth Rate | 31.7% | 27.2% | 13.7% |
| EPS (RMB) | 1.14 | 1.44 | 1.64 |
| PE | 26.9x | 21.2x | 18.6x |
The driving effect of plummeting silver inventories on the company’s profitability is achieved through the following path:
Inventory Decline → Tight Supply → Silver Price Increase → Higher Mining Enterprise Revenue → Profit Growth
Assuming Xingye Silver-Tin produces approximately 280 tonnes of silver annually (calculated as approximately 283 tonnes for the full year based on 212.16 tonnes in the first three quarters), based on the current silver price of $59 per ounce:
| Silver Price Change | Silver Price (USD/oz) | Annual Incremental Silver Product Revenue (RMB 100 million) |
|---|---|---|
| +10% | 64.9 | +2.8 |
| +20% | 70.8 | +5.6 |
| +50% | 88.5 | +14.0 |
| +100% | 118 | +28.0 |
Benefiting from the consolidation of Yubang Mining, Xingye Silver-Tin’s revenue structure has undergone significant changes [5]:
- Mine-Produced Silver: RMB 1.489 billion(36.33%) ——Has become the largest revenue source
- Mine-Produced Tin: Approximately RMB 1.35 billion (33.04%)
- Mine-Produced Zinc, Lead, etc.: Approximately RMB 1.26 billion (approximately 30%)
This change means that
Xingye Silver-Tin is in a golden development period of “simultaneous growth in volume and price”:
- Capacity expansion from the consolidation of Yubang Mining
- Subsidiary mines resumed production ahead of schedule, and all mining and dressing systems operated well in 2025
- Capacity recovery at Yinman Mining after resuming production
- Sustained silver inventory drawdown supports high silver prices
- Sustained growth in industrial demand (photovoltaics, AI, new energy vehicles)
- Expectations of global liquidity easing and safe-haven demand
Based on current financial data and silver price sensitivity analysis:
| Scenario | Silver Price Assumption | Operating Revenue (RMB 100 million) | Net Profit (RMB 100 million) | Net Profit Margin |
|---|---|---|---|---|
| Conservative | $50/oz | 45-48 | 16-18 | 35% |
| Neutral | $60/oz | 52-55 | 20-22 | 38% |
| Optimistic | $70/oz | 58-62 | 24-27 | 41% |
The company’s current profit elasticity coefficient is approximately:
| Company | Stock Code | Silver Reserves | Market Capitalization (RMB 100 million) | P/E | Main Business |
|---|---|---|---|---|---|
Xingye Silver-Tin |
000426.SZ | 27,200 tonnes (1st in Asia) | 748.3 | 46.94 | Silver and tin mining and dressing |
| Yintai Gold | 000975.SZ | Approximately 5,000 tonnes | 320 | 28.5 | Gold and silver mining and dressing |
| Hunan Gold | 002155.SZ | Approximately 3,000 tonnes | 180 | 35.2 | Gold, antimony, and tungsten mining |
| Jiangxi Copper | 600362.SS | By-product silver | 1200 | 12.5 | Comprehensive copper, gold, and silver mining and processing |
- Largest Resource Reserves: Listed company with the largest silver reserves in Asia
- Highest Business Purity: Main business is highly focused on silver and tin mining and dressing
- Strongest Growth: Expected net profit growth rate of 31.7% in 2025
From a valuation perspective, Xingye Silver-Tin’s current P/E ratio is 46.94x, which is higher than the industry average, mainly reflecting the market’s expectations for the company’s future growth. With continued silver price increases and capacity release, the valuation is expected to be gradually digested through performance growth.
Silver prices are affected by multiple factors and face volatility risks [4][5]:
- Margin increases by overseas exchanges may dampen speculative bullish sentiment
- Excessive short-term gains may trigger a technical correction
- Changes in macroeconomic expectations affect safe-haven demand
- Safety Accident Risk: Mining production has inherent safety risks
- Project Construction Progress: The progress of mine development and capacity expansion may fall short of expectations
- Major Shareholder Debt Risk: Attention should be paid to the financial status of the major shareholder
- Risk of sharp fluctuations in metal prices
- Exchange rate fluctuations affect export revenue
- Changes in international trade environment
- Plummeting inventories are real fundamental support: The 30-75% decline in global silver inventories represents a tangible supply tightening, providing solid bottom support for silver prices.
- Supply-demand mismatch is a long-term trend: Emerging demand from AI, photovoltaics, etc. continues to grow, while mine-side supply growth is weak, and the silver supply-demand deficit is expected to persist.
- Xingye Silver-Tin is the best beneficiary target:
- 1st in Asia, 8th globally in silver reserves
- Silver has become the largest revenue source (36.33% share)
- Expected net profit growth rate of 31.7% in 2025
- Volume-price growth pattern has formed: Capacity expansion combined with rising silver prices has brought the company into a period of rapid profit growth.
| Indicator | 2024A | 2025E | 2026E | 2027E |
|---|---|---|---|---|
| Operating Revenue (RMB 100 million) | 42.7 | 52.31 | 62.73 | 70.00 |
| Net Profit (RMB 100 million) | 15.3 | 20.15 | 25.63 | 29.14 |
| EPS (RMB) | 0.86 | 1.14 | 1.44 | 1.64 |
| PE | 49x | 37x | 29x | 26x |
Plummeting silver inventories have a significant driving effect on the profitability of mining enterprises such as Xingye Silver-Tin, mainly reflected in the following aspects:
- Price Side: Inventory decline drives silver price increases, directly increasing sales revenue
- Revenue Structure: Silver has become the company’s largest revenue source, with a significant volume-price growth effect
- Profit Elasticity: It is expected that for every 10% increase in silver prices, net profit will grow by approximately 15-18%
- Valuation Support: Resource scarcity and growth provide a basis for valuation premium
For investors, as the purest silver target in the A-share market, Xingye Silver-Tin has high investment value against the backdrop of a silver bull market. However, attention should be paid to the correction risk brought by excessive short-term gains, and it is recommended to accumulate positions on dips.
[1] 21st Century Business Herald - “Macro and Supply-Demand Resonance, Silver Rises Strongly | Futures Weekly Report” (https://www.21jingji.com/article/20251208/herald/7c7c12cfd1f03e452ff8cf9ec11b627e.html)
[2] CNGold - “Weak Non-Farm Payrolls + Plummeting Inventories Trigger Silver Squeeze Surge, Leading to Precious Metals Differentiation” (https://www.cngold.org/c/2025-12-17/c10236937.html)
[3] Xincai.com - “Deciphering the New Main Line of Metals: Gold and Silver Get a Good Start! Can the ‘Big Bull’ Sustain?” (https://www.xincai.com/article/nheypcx1489340)
[4] Eastmoney.com - In-Depth Research Report on Xingye Silver-Tin (000426.SZ) (https://pdf.dfcfw.com/pdf/H3_AP202505161673950688_1.pdf)
[5] Eastmoney.com - Research Report on Xingye Silver-Tin (000426.SZ) (https://pdf.dfcfw.com/pdf/H3_AP202511031774267173_1.pdf)
[6] Jinling AI - Real-Time Market Data of Xingye Silver-Tin [0]
Insights are generated using AI models and historical data for informational purposes only. They do not constitute investment advice or recommendations. Past performance is not indicative of future results.
About us: Ginlix AI is the AI Investment Copilot powered by real data, bridging advanced AI with professional financial databases to provide verifiable, truth-based answers. Please use the chat box below to ask any financial question.