Analysis Report on Military Order Growth and Valuation Recovery of China Spacesat (600118.SH)
Unlock More Features
Login to access AI-powered analysis, deep research reports and more advanced features

About us: Ginlix AI is the AI Investment Copilot powered by real data, bridging advanced AI with professional financial databases to provide verifiable, truth-based answers. Please use the chat box below to ask any financial question.
Related Stocks
I have now collected sufficient data and will conduct a comprehensive analysis for you.
China Spacesat Co.,Ltd. is the
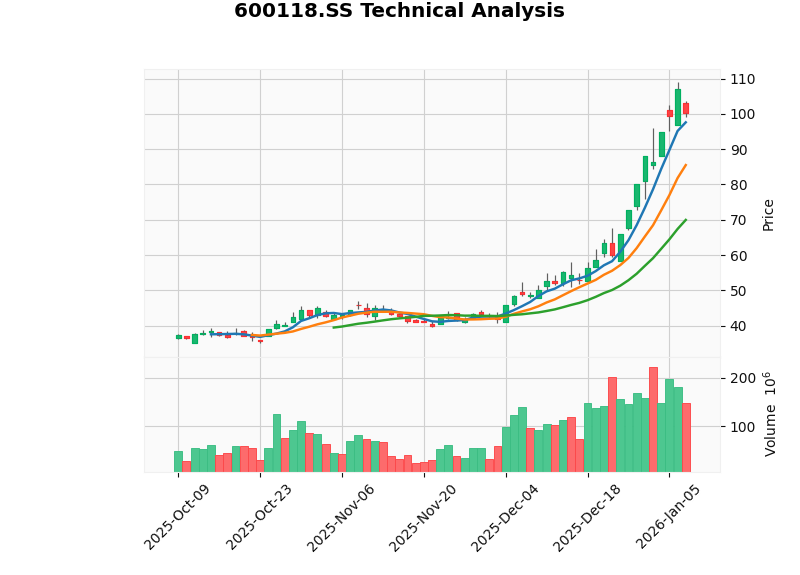
From the perspective of market performance, the company’s stock price has experienced a sharp rise recently. As of the close on January 7, 2026, the company’s stock price closed at
| Statistical Period | Price Change | Remarks |
|---|---|---|
| 1-Day | -6.34% | Short-term pullback |
| 5-Day | -0.76% | Volatile adjustment |
| 1-Month | +107.47% | Short-term surge |
| 3-Month | +168.79% | Trend-based rise |
| 6-Month | +256.06% | Mid-term strength |
| 1-Year | +281.83% | Annual top-performing stock |
| 3-Year | +356.01% | Long-term strength |
The investment value of China Spacesat mainly relies on the following three major industrial trends:
- Plans to launch approximately 13,000 satellites, with the constellation scheduled to be completed by 2030
- China Spacesat undertakes 50%-60% of the satellite R&D and manufacturing share, holding an absolute leading position in the industry
- 28 satellites were delivered in 2025, with 540-720 satellitesscheduled for delivery in 2026 [1][2]
- Won the bid for the third batch of 12 satellite orders, with a contract value exceeding RMB 320 million
- Plans to deliver 30-50 satellites in 2026, with supporting component orders exceeding 250 sets[1]
- Asia’s largest satellite manufacturing base, officially commissioned by the end of 2025
- Production capacity increased from the original 200-300 satellites/year to 1,500 satellites/year[1][2]
According to public market information, China Spacesat’s current order backlog is at a historical high:
| Order Type | Scale/Amount | Planned Delivery in 2026 | Gross Profit Margin |
|---|---|---|---|
| GW Constellation | Approximately 50% share | 540-720 satellites | 45%-55% |
| Qianfan Constellation | 12 satellites + 250 sets of components | 30-50 satellites | Higher than traditional business |
| Military Satellites | RMB 120 million | Delivery in Q4 | Traditional level |
| New Energy Supporting | RMB 290 million | 2025-2026 | Energy storage business |
- 2025Q3:Net profit of RMB 45.3 million, a year-on-year increase of 294.92%, marking the first realization of order delivery and turning losses into profits
- 2025Q4:Acceptance of the RMB 120 million military order, with full-year net profit exceeding RMB 47 million
- 2026Q1:Delivery of the first batch of satellites for China Satellite Network Group, with operating revenue of RMB 1.5-1.8 billion
- 2026Q4:Annual delivery peak, with operating revenue of RMB 2.5-2.8 billion, accounting for 40% of the full-year total
- 2027:Expected operating revenue of RMB 7.8-8.8 billion [1]
The commissioning of the Hainan Satellite Super Factory marks a qualitative leap in China Spacesat’s manufacturing capability:
| Phase | Production Capacity (Satellites/Year) | Actual Deliveries (Satellites) | Capacity Utilization Rate |
|---|---|---|---|
| 2025 | 150 | 90-120 | 15% |
| 2026 | 900 | 540-720 | 72%-87% |
| 2027 | 1,500 | 900-1,200 | Nearly 100% |
From the perspective of traditional valuation, China Spacesat’s valuation level is in an extremely high range:
| Valuation Indicator | Value | Industry Comparison |
|---|---|---|
| Price-to-Earnings Ratio (P/E) | 2062-2505x | Significantly high |
| Price-to-Book Ratio (P/B) | 18.66x | Relatively high |
| Price-to-Sales Ratio (P/S) | 18.00x | Relatively high |
| ROE (Return on Equity) | 0.91% | Extremely low |
| Net Profit Margin | 0.87% | Extremely low |
| Operating Profit Margin | -0.91% | Loss-making status |
From the perspective of financial health assessment, the company has
Valuation calculation using the Discounted Cash Flow (DCF) model shows a
| Valuation Scenario | Intrinsic Value | Deviation from Current Stock Price |
|---|---|---|
| Conservative Scenario | $6.83 | -93.2% |
| Baseline Scenario | $8.05 | -92.0% |
| Optimistic Scenario | $10.30 | -89.7% |
| Weighted Average | $8.39 | -91.6% |
| Parameter | Conservative Scenario | Baseline Scenario | Optimistic Scenario |
|---|---|---|---|
| Revenue Growth Rate | 0% | -7.4% | 0% |
| EBITDA Margin | 5.0% | 5.3% | 5.6% |
| Terminal Growth Rate | 2.0% | 2.5% | 3.0% |
| Cost of Equity | 10.6% | 9.1% | 7.6% |
| Cost of Debt | 4.3% | 3.3% | 2.3% |
| WACC | 9.1% | 9.1% | 9.1% |
DCF analysis shows that even under the most optimistic assumptions, the company’s reasonable valuation is only in the range of
Assuming China Spacesat can complete deliveries fully in accordance with market expectations:
| Forecast Source | 2026 Operating Revenue Forecast | Year-on-Year Growth | Net Profit Forecast |
|---|---|---|---|
| Brokerage Optimistic Forecast | RMB 6.5-7.2 billion | +15%-25% | Over RMB 116 million |
| DCF Baseline Assumption | Approximately RMB 4 billion | Flat | Approximately RMB 50 million |
- GW Constellation delivers 540-720 satellites as scheduled
- Value per satellite is RMB 80-120 million
- Gross profit margin increases to around 15%
- Expense ratio remains stable
From the perspective of the divergence between stock price growth and fundamentals:
- The stock price has risen by 256%in the past 6 months, while operating revenue only increased by approximately 85% during the same period
- The P/E ratio has risen from approximately 100x to over 2500x
- The expectations implied by the current stock price have exceeded any reasonable performance growth path
Liu Zhongyu, Chief Analyst of Military Machinery at CICC, pointed out: “
The core logic of this view is:
- The satellite industry is in a transition period from “technological exploration” to “large-scale development”
- Traditional valuation methods may not be applicable to the current stage
- Sustained high-speed growth is required to digest the current high valuation
| Financial Indicator | Current Level | Improvement Target | Gap |
|---|---|---|---|
| Gross Profit Margin | 9.62% | 15%+ | +5.38pp |
| Net Profit Margin | 0.87% | 5%+ | +4.13pp |
| ROE | 0.91% | 10%+ | +9.09pp |
Looking at historical data, although the company’s profitability improved in the first three quarters of 2025, there is still a huge gap between the current profitability level and that required to support the current valuation [0][2].
| Driver | Expected Effect | Time Window |
|---|---|---|
| Improvement in Capacity Utilization of Hainan Factory | Cost reduction, profit expansion | Full year of 2026 |
| Increase in Proportion of High-Gross-Profit Constellation Orders | Gross profit margin improvement | 2026-2027 |
| Emergence of Scale Effects | Expense ratio reduction | 2026-2027 |
| Continuous Order Landing | Certainty of revenue growth | Ongoing |
According to the latest technical analysis data [0]:
| Indicator | Value | Signal Interpretation |
|---|---|---|
| MACD | No death cross | Uptrend not completely broken |
| KDJ | K:89.8, D:90.7, J:88.0 | Overbought zone, risk of death cross |
| RSI | Overbought | Risk zone |
| 20-Day Moving Average | $69.96 | Short-term support level |
| 50-Day Moving Average | $53.97 | Mid-term trend support |
| Beta | 0.66 | Low correlation with the broader market |
| Trend Judgment | Sideways consolidation | No clear direction |
- Support Level: $69.96 (20-Day Moving Average)
- Resistance Level: $103.46
From the market perspective, the satellite industry as a whole has been continuously sought after by capital:
- The Satellite Industry ETF (159218) has seen capital inflows of nearly RMB 800 millionin the past five days
- Share increase of 100%in the past ten days
- The CSI Satellite Index rose by nearly 80%in 2025 [3]
However, it is worth noting that the ETF pulled back on January 7, 2026, with capital showing characteristics of
| Risk Type | Specific Description | Impact Level |
|---|---|---|
| Delivery Delay Risk | Satellite manufacturing involves complex supply chains, which may lead to delivery delays | Medium |
| Technical Risk | Low-orbit satellite networking technology is still in the verification stage | Medium |
| Competition Risk | Qianfan Constellation may divert order share from GW Constellation | Low |
| Price Risk | The price per satellite may decline in the later stage of constellation construction | Medium |
- The current stock price has fully reflected optimistic expectations for the next 2-3 years
- Any reduction in orders, delivery delays, or lower-than-expected gross profit margin may lead to a sharp pullback in the stock price
- Average daily turnover of approximately RMB 8.7 billion in the past 3 months, with high turnover rate
- Once market sentiment shifts, there may be insufficient liquidity to absorb selling pressure
- The military industry sector is greatly affected by policies
- Factors such as China-US relations and geopolitics may affect market risk appetite
| Risk Indicator | Current Status | Warning Level |
|---|---|---|
| Cash Flow | Negative operating cash flow | Yellow Warning |
| Profitability | Net profit margin less than 1% | Yellow Warning |
| Valuation Level | PE>2000x | Red Warning |
| Evaluation Dimension | Rating | Description |
|---|---|---|
| Order Certainty | ★★★★☆ | Orders in hand exceed RMB 30 billion, scheduled for production through 2027 |
| Capacity Support | ★★★★★ | Hainan Factory commissioned, production capacity increased by more than 3 times |
| Profitability | ★★☆☆☆ | Current profitability is extremely weak, ROE less than 1% |
| Valuation Rationality | ★☆☆☆☆ | Stock price is over 90% higher than DCF intrinsic value |
| Technical Aspects | ★★★☆☆ | Overbought zone, with adjustment pressure |
-
Order growth is real, but has been fully priced in
- Orders in hand exceeding RMB 30 billion are indeed positive
- However, the current stock price has fully or even over-reflected this expectation
- The stock price is over 90% higher than the DCF intrinsic value
-
Valuation recovery requires more time and stronger performance realization
- Even if operating revenue reaches RMB 6.5-7.2 billion in 2026, the P/E ratio calculated based on the current stock price will still exceed 100x
- Net profit needs to reach over RMB 1 billion to support the current valuation (calculated at 30x P/E)
- This requires the gross profit margin to increase from 9.62% to over 20%, which is quite difficult
-
Short-term risks outweigh opportunities
- Technical indicators show overbought status
- 1-day drop of over 6%, market sentiment has shown divergence
- The degree of divergence between valuation and fundamentals is also at an extreme level in the A-share market
| Investor Type | Strategic Recommendation | Reason |
|---|---|---|
| Short-Term Trader | Avoid | Extremely high valuation risk, violent fluctuations |
| Medium-Term Investor | Wait and See | Wait for valuation regression or performance verification |
| Long-Term Investor | Wait | Current price lacks a margin of safety |
| Risk Preferencer | Small Position | Only for extremely small position theme speculation |
- Participate in industry beta through the Satellite Industry ETF (159518) to reduce individual stock risk
- Wait for the stock price to pull back to the RMB 50-60 range before considering entry
- Focus on the actual performance realization in the 2026 Q1 report and interim report
[0] Jinling AI Brokerage API Data - Company Overview, Financial Analysis, DCF Valuation, Technical Analysis, Real-time Market Quotes
[1] Eastmoney - “China Spacesat has over RMB 30 billion in orders in hand, scheduled through 2027, 2026 is a big year for mass deliveries” (https://caifuhao.eastmoney.com/news/20260102110431488238260)
[2] Zhihu Column - “Panoramic Analysis of Investment Opportunities from Thousand-Satellite Manufacturing to Commercial Aerospace” (https://zhuanlan.zhihu.com/p/1982379144554759175)
[3] Sina Finance - “Has the Satellite Industry Overextended Valuation? CICC Chief Liu Zhongyu: In the accelerated growth period, performance realization is expected to digest valuation” (https://finance.sina.com.cn/roll/2026-01-07/doc-inhfmycs5210314.shtml)
[4] Huxiu - “Space Enclosure: Certain Opportunities in the Sino-US 10,000-Satellite Race” (https://pro.huxiu.com/article/4816701.html)
Insights are generated using AI models and historical data for informational purposes only. They do not constitute investment advice or recommendations. Past performance is not indicative of future results.
About us: Ginlix AI is the AI Investment Copilot powered by real data, bridging advanced AI with professional financial databases to provide verifiable, truth-based answers. Please use the chat box below to ask any financial question.