HSBC Raises Silver Price Forecast: Analysis of Precious Metals Investment Strategies Amid Narrowing Supply Gap
Unlock More Features
Login to access AI-powered analysis, deep research reports and more advanced features

About us: Ginlix AI is the AI Investment Copilot powered by real data, bridging advanced AI with professional financial databases to provide verifiable, truth-based answers. Please use the chat box below to ask any financial question.
On January 7, 2026, HSBC released a report raising its
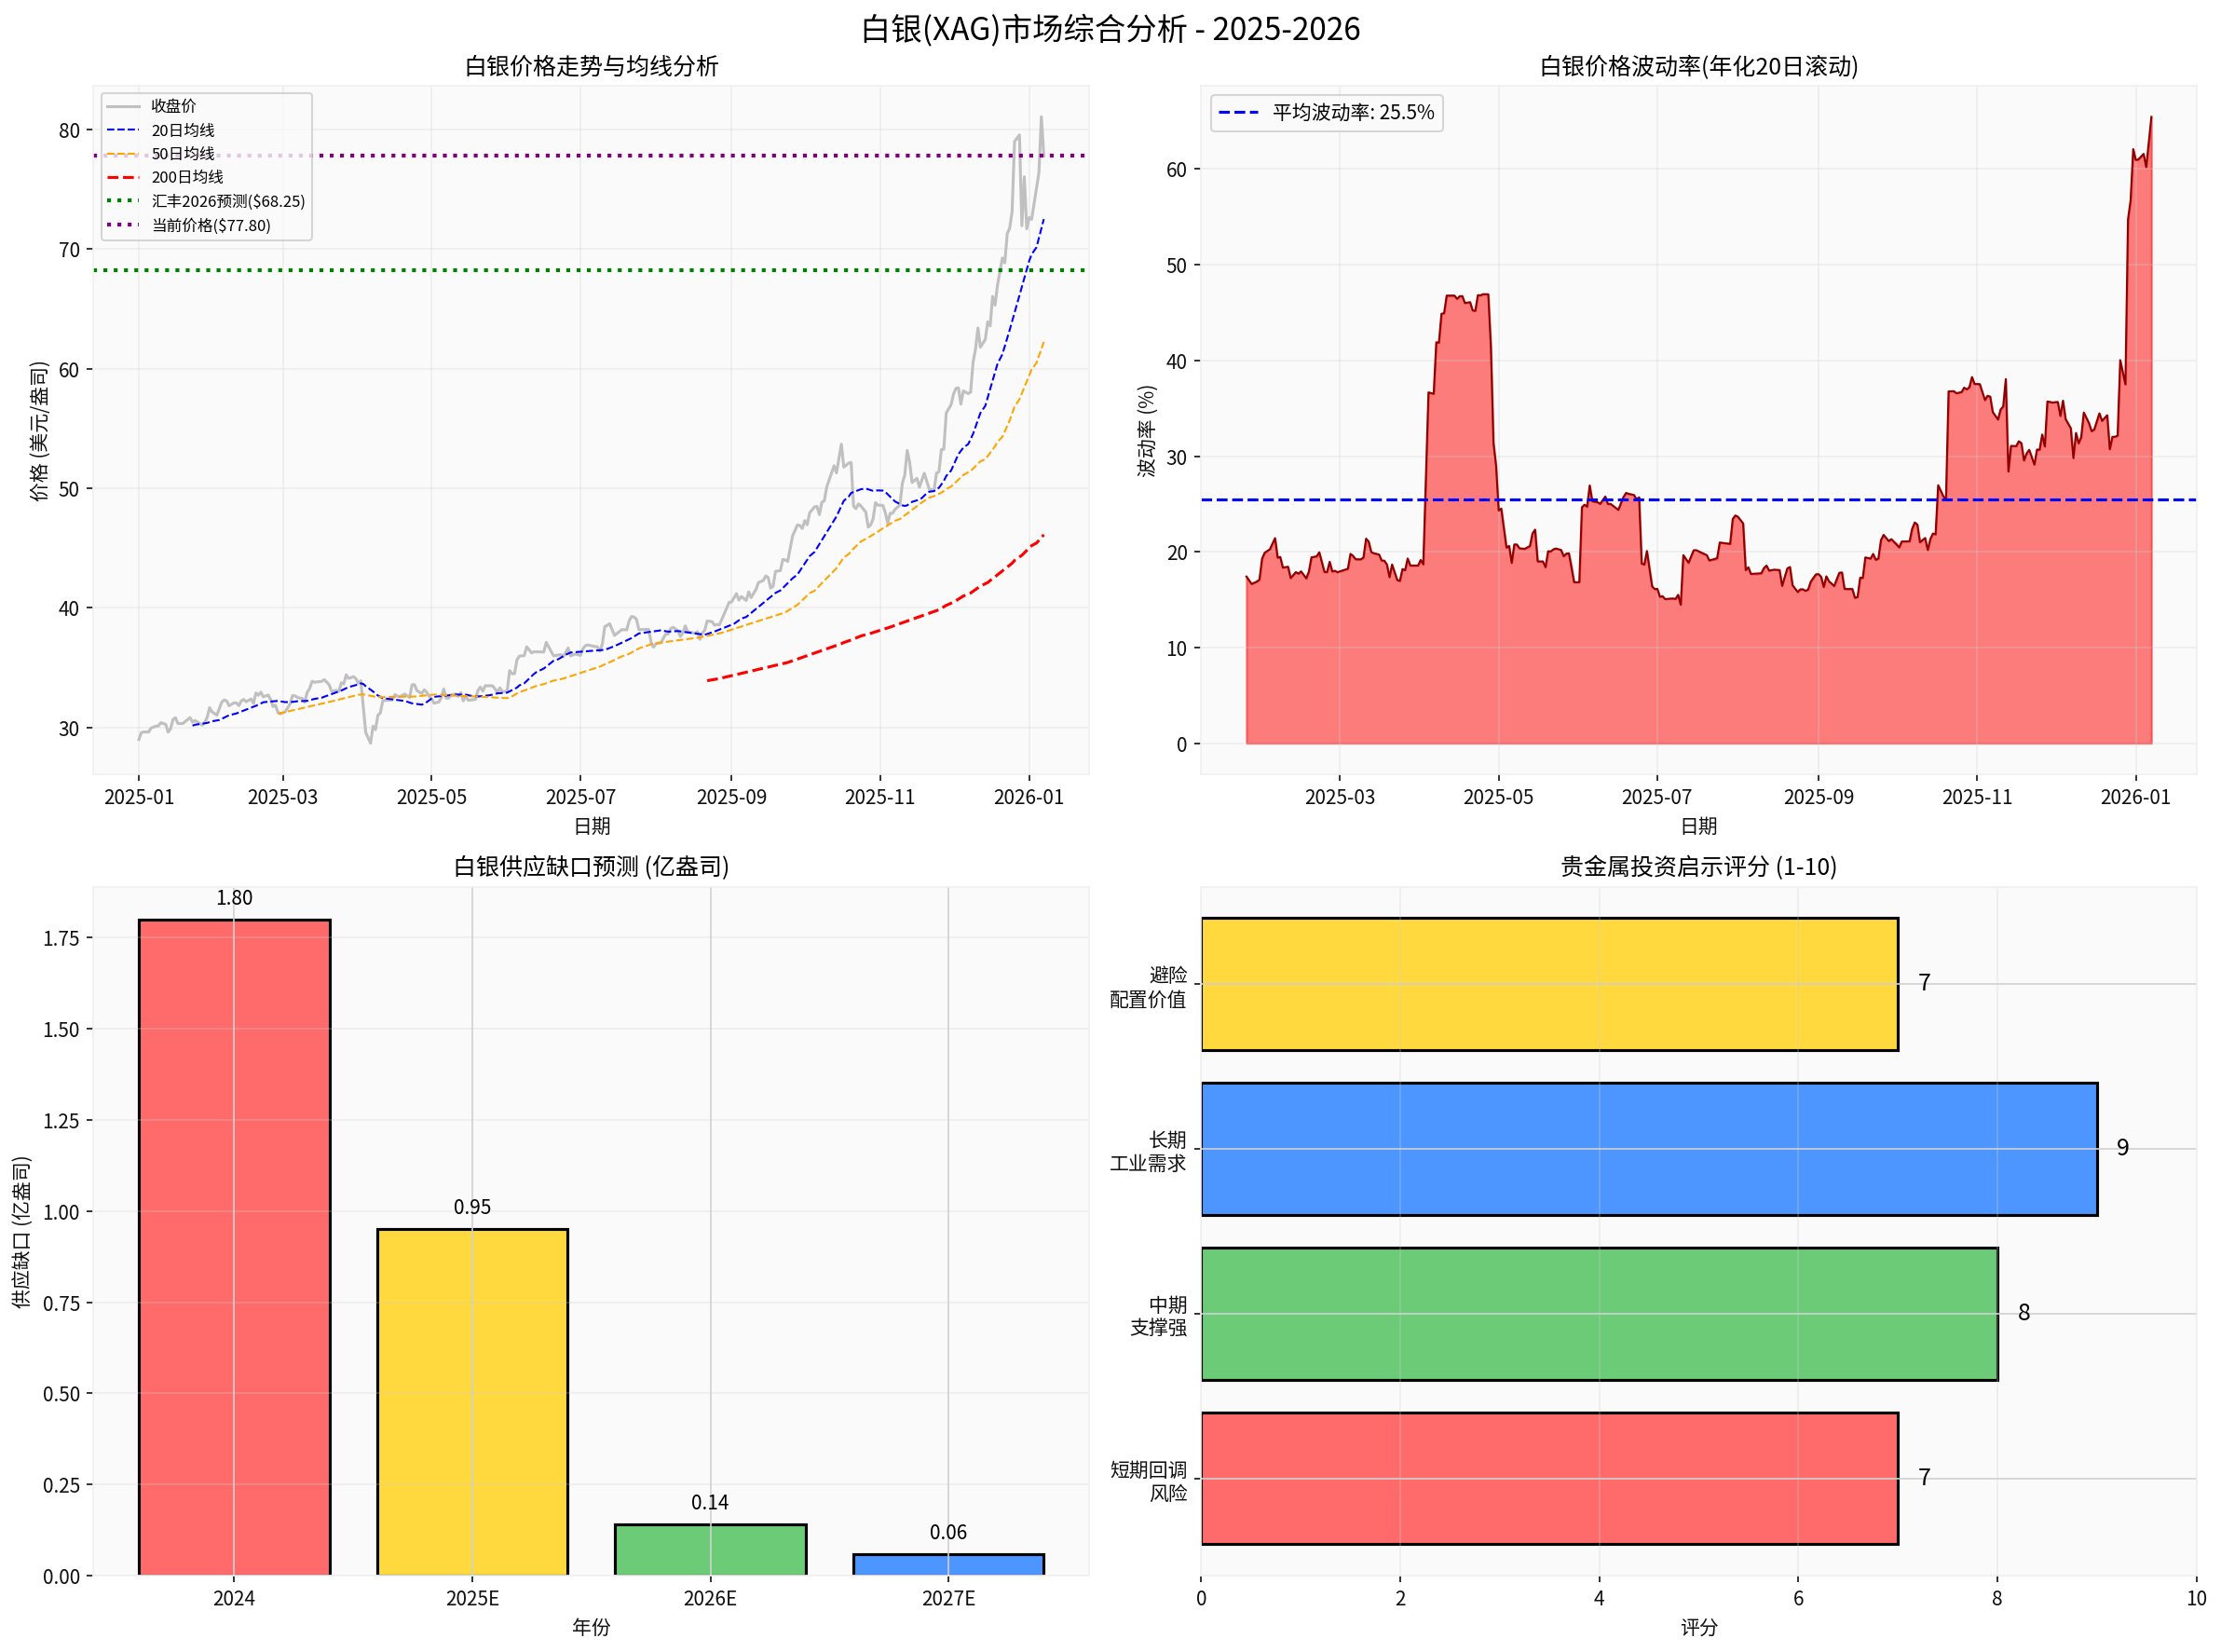
According to HSBC’s forecast,
| Indicator | Value |
|---|---|
| Current Price (January 7, 2026) | $77.80/oz [0] |
| 2026 HSBC Forecast | $68.25/oz[1] |
| 2027 HSBC Forecast | $57.00/oz[1] |
| YTD 2025 Increase | 168.50% [0] |
| Period High | $83.94/oz[0] |
| Period Low | $27.97/oz[0] |
| Indicator | Value | Interpretation |
|---|---|---|
| 20-Day Moving Average | $72.52 | Short-term uptrend remains intact |
| 50-Day Moving Average | $62.25 | Mid-term uptrend is clear |
| 200-Day Moving Average | $46.11 | Long-term moving average provides strong support |
| Price Relative to 200-Day Moving Average | +68.75% |
In historical high range[0] |
| 20-Day Annualized Volatility | 65.45% |
Price fluctuations are extreme[0] |
According to World Silver Association data,
| Year | Supply Gap (100 Million Ounces) | Narrowing Rate |
|---|---|---|
| 2024 | 1.80 | - |
| 2025E | 0.95 | 47.2% |
| 2026E | 0.14 | 85.3% |
| 2027E | 0.059 | 57.9% |
- Recovering Mining Output: 2025 global mined silver production fell to 820 million ounces[3], but high prices have given miners stronger incentives to increase output
- Inventory Replenishment: TD Securities notes that the London silver market is making up for inventory losses from the past year, with potentially over 212 million ounces of physical silver available for free access[3]
- Increased Recycled Silver Supply: High prices stimulate scrap silver recycling
Despite the narrowing supply gap,
- Photovoltaic Industry: 2025 global photovoltaic silver usage reached 7,560 tons, doubling from 2022, and its share of total global silver demand surged from 20% to 55%[3]
- New Energy Vehicles: 2025 silver consumption reached 2,566 tons, an increase of over 520 tons[3]
- AI and Data Centers: Silver usage is 30% higher than that of traditional equipment[3]
The current silver price
- Price-Forecast Divergence: The current price of $77.80 is approximately 12% higher than HSBC’s 2026 forecast of $68.25
- Technical Overbought: The price is 68.75% above the 200-day moving average, in a historical high range[0]
- Surge in Volatility: Annualized volatility reaches 65.45%, indicating extreme market exuberance[0]
Well-known macro strategist Lyn Alden warned: “When I see people on Twitter saying ‘silver $60’, ‘silver $61’, ‘silver $62’, my contrarian senses start tingling… I wouldn’t be surprised by a silver correction”[4].
Despite short-term correction risks, mid-term fundamentals still support silver prices:
| Support Factor | Impact Analysis |
|---|---|
Geopolitical Risks |
Situations in Venezuela, disputes over Greenland, etc., boost safe-haven demand[2] |
Fed Rate Cut Expectations |
Loosening monetary environment reduces holding costs for precious metals[5] |
Weakening US Dollar |
Enhances the attractiveness of US dollar-denominated precious metals[5] |
Central Bank Gold Buying Spree |
Global central banks continue to increase gold holdings, driving the overall valuation of precious metals[5] |
The
- Precious Metal Attribute: Safe-haven and capital preservation functions
- Industrial Attribute: Demand growth driven by the new energy revolution
Hou Yanjun, General Manager of Houshi Tiancheng Investment, stated: “At the start of 2026, the gold and silver markets continued their strong rally… Gold and silver may maintain a relatively strong trend in the short term”[5].
| Precious Metal | Allocation Ratio | Participation Method | Strategy Key Points |
|---|---|---|---|
| Gold | 5%-10% | Gold ETFs, Physical Gold Bars | Long-term allocation to avoid systemic risks |
| Silver | 2%-5% | Silver ETFs, Futures | Swing trading, strictly control position size |
Sui Dong, Researcher at PaiPaiWang, advised: “Control the gold allocation ratio at 5% to 10% of total assets, and participate via gold ETFs, physical gold bars, etc. Silver is suitable for swing trading; position size must be strictly controlled, and chasing highs is not advisable. It is appropriate to build positions in batches during pullbacks”[5].
- Technical Correction Risk: The price may retest the monthly-level support around $60 per ounce[2]
- Industrial Demand Falls Short of Expectations: A slowdown in photovoltaic installed capacity growth may weaken silver price support[3]
- US Dollar Rebound Risk: The Fed’s policy shift may be less than expected
- Unexpected Inventory Release: Large-scale silver supply replenishment may disrupt the supply-demand balance[3]
HSBC’s sharp upward revision of its silver price forecast reflects the market’s consensus on long-term optimism for precious metals. However,
- Short-Term: Avoid chasing highs; wait for layout opportunities after pullbacks
- Mid-Term: Buy on dips after pullbacks, with a mid-term target range of $60-$68 per ounce
- Long-Term: As an important component of portfolio allocation, benefit from industrial demand dividends brought by the new energy revolution
As
[1] Cailian Press - HSBC Forecasts 2026 Average Silver Price at $68.25 per Ounce (https://www.163.com/dy/article/KIMP681205198CJN.html)
[2] Sina Finance - HSBC Sharply Raises Silver Price Expectations Amid Supply-Demand Imbalance and Rising Safe-Haven Demand (https://finance.sina.com.cn/7x24/2026-01-07/doc-inhfnqzm6192802.shtml)
[3] TradingKey - Silver and Copper Surge, Gold Continues to Rally! Will Gold, Silver and Copper Prices Continue to Skyrocket in 2026? (https://www.tradingkey.com/zh-hans/analysis/commodities/metal/251382306-gold-silver-copper-xau-xag-prediction-2026-tradingkey)
[4] Wall Street CN - Silver Could Hit $100 in 2026, But It’s No Longer a “Low-Risk, High-Reward” Opportunity (https://wallstreetcn.com/articles/3762221)
[5] Securities Times - Gold and Silver Prices Soar! How Should Investors Operate? (https://stcn.com/article/detail/3574923.html)
[0] Jinling AI Financial Database - Silver (XAG) Price Data and Technical Analysis
Insights are generated using AI models and historical data for informational purposes only. They do not constitute investment advice or recommendations. Past performance is not indicative of future results.
About us: Ginlix AI is the AI Investment Copilot powered by real data, bridging advanced AI with professional financial databases to provide verifiable, truth-based answers. Please use the chat box below to ask any financial question.