Yijing Optoelectronics (600537) Delisting Risk and Fundamental Analysis Report
Unlock More Features
Login to access AI-powered analysis, deep research reports and more advanced features

About us: Ginlix AI is the AI Investment Copilot powered by real data, bridging advanced AI with professional financial databases to provide verifiable, truth-based answers. Please use the chat box below to ask any financial question.
Related Stocks
Based on the comprehensive data I have collected, I now provide you with an in-depth analysis report on Yijing Optoelectronics’ delisting risk and fundamentals.
According to the performance pre-loss prompt announcement disclosed by Yijing Optoelectronics on
This means:
- The net profit loss attributable to shareholders in 2025 may reach over RMB 500 million
- The end-of-period net assets in 2025 may be negative
- In accordance with Paragraph 2 of Article 9.3.2 of the Shanghai Stock Exchange Stock Listing Rules which stipulates “the audited end-of-period net assets in the most recent fiscal year are negative”, the company may be subject to delisting risk warning (*ST)[1][2]
| Risk Trigger Condition | Specific Situation | Risk Level |
|---|---|---|
| Negative Net Assets | Expected to be negative by the end of 2025 | High Risk |
| Negative Net Profit | Continuous losses with expanding deficit | High Risk |
| Revenue Decline | 42.58% year-on-year decline in revenue in the first three quarters | Medium-High Risk |
Based on the latest financial data, Yijing Optoelectronics’ fundamentals show a trend of
| Financial Indicator | Value | Industry Normal Level | Assessment |
|---|---|---|---|
| ROE (Return on Equity) | -520.26% |
5%-15% | Severely Deteriorated |
| Net Profit Margin | -74.51% |
3%-8% | Severe Loss |
| Operating Profit Margin | -85.69% |
5%-10% | Severe Loss |
| Current Ratio | 0.88 |
1.5-2.0 | Tight Liquidity |
| Quick Ratio | 0.75 |
1.0-1.5 | Short-Term Debt Repayment Pressure |
- The company’s P/E ratio is -2.95x, indicating market expectations of continuous losses
- The P/B ratio is as high as 22.69x, reflecting possible severe erosion of net assets
- Current ratio is below 1, indicating current assets are insufficient to cover current liabilities
| Reporting Period | Revenue (RMB 100 million) | Year-on-Year Change | Net Profit (RMB 100 million) | EPS (RMB) |
|---|---|---|---|---|
| Q3 2025 | 3.75 | - | -0.05 | -0.05 |
| Q2 2025 | 5.73 | - | -0.07 | -0.07 |
| Q1 2025 | 6.08 | - | -0.04 | -0.04 |
| Q4 2024 | 7.69 | - | -1.21 |
-1.21 |
In the
As of December 26, 2025, the company and its consolidated subsidiaries have accumulated
- As plaintiff/applicant: 10 cases, involving an amount of RMB 26.3416 million
- As defendant/respondent: 13 cases, involving an amount of RMB 44.8215 million
On December 28, 2025, the company disclosed that the
The difficulties faced by Yijing Optoelectronics are not an isolated case, but a typical example against the backdrop of
| Time Period | Loss Amount of Main Photovoltaic Industry Chain Enterprises |
|---|---|
| First three quarters of 2025 | RMB 31.039 billion |
| Of which: Q3 | RMB 6.422 billion (narrowed by 46.7% compared to Q2) |
Based on the projection of 2025 full-year photovoltaic installed capacity by the China Photovoltaic Industry Association[1]:
- Domestic module market demand in the second half of 2025: 57.8GW~87.8GW
- Photovoltaic module output in the same period can reach: 337.5GW
- The supply-demand imbalance remains severe
In 2025, “anti-involution” has become the core consensus of the photovoltaic industry[3][4]:
- Starting from July, prices of main industrial chain products such as silicon materials have bottomed out and rebounded (spot price of silicon materials rebounded from RMB 35,400/ton to RMB 53,600/ton)
- Leading enterprises such as Daqo New Energy and GCL Technology turned profitable in Q3 ahead of others
- The industry has shifted from comprehensive losses to structural profits, showing a periodic inflection point
However,
- The implementation strength of industry self-discipline
- The breakthrough speed of technological innovation
- The improvement of policies and market mechanisms
| Period | Change |
|---|---|
| 1 Day | +0.70% |
| 5 Days | +4.61% |
| 1 Month | +6.95% |
| 3 Months | +8.29% |
| 6 Months | +31.40% |
| 1 Year | +46.10% |
| 3 Years | -30.48% |
Despite the deterioration of fundamentals, the stock price
- Market expectations of an industry reversal
- Speculation by hot money on delisting concept stocks
- Demand for technical rebound
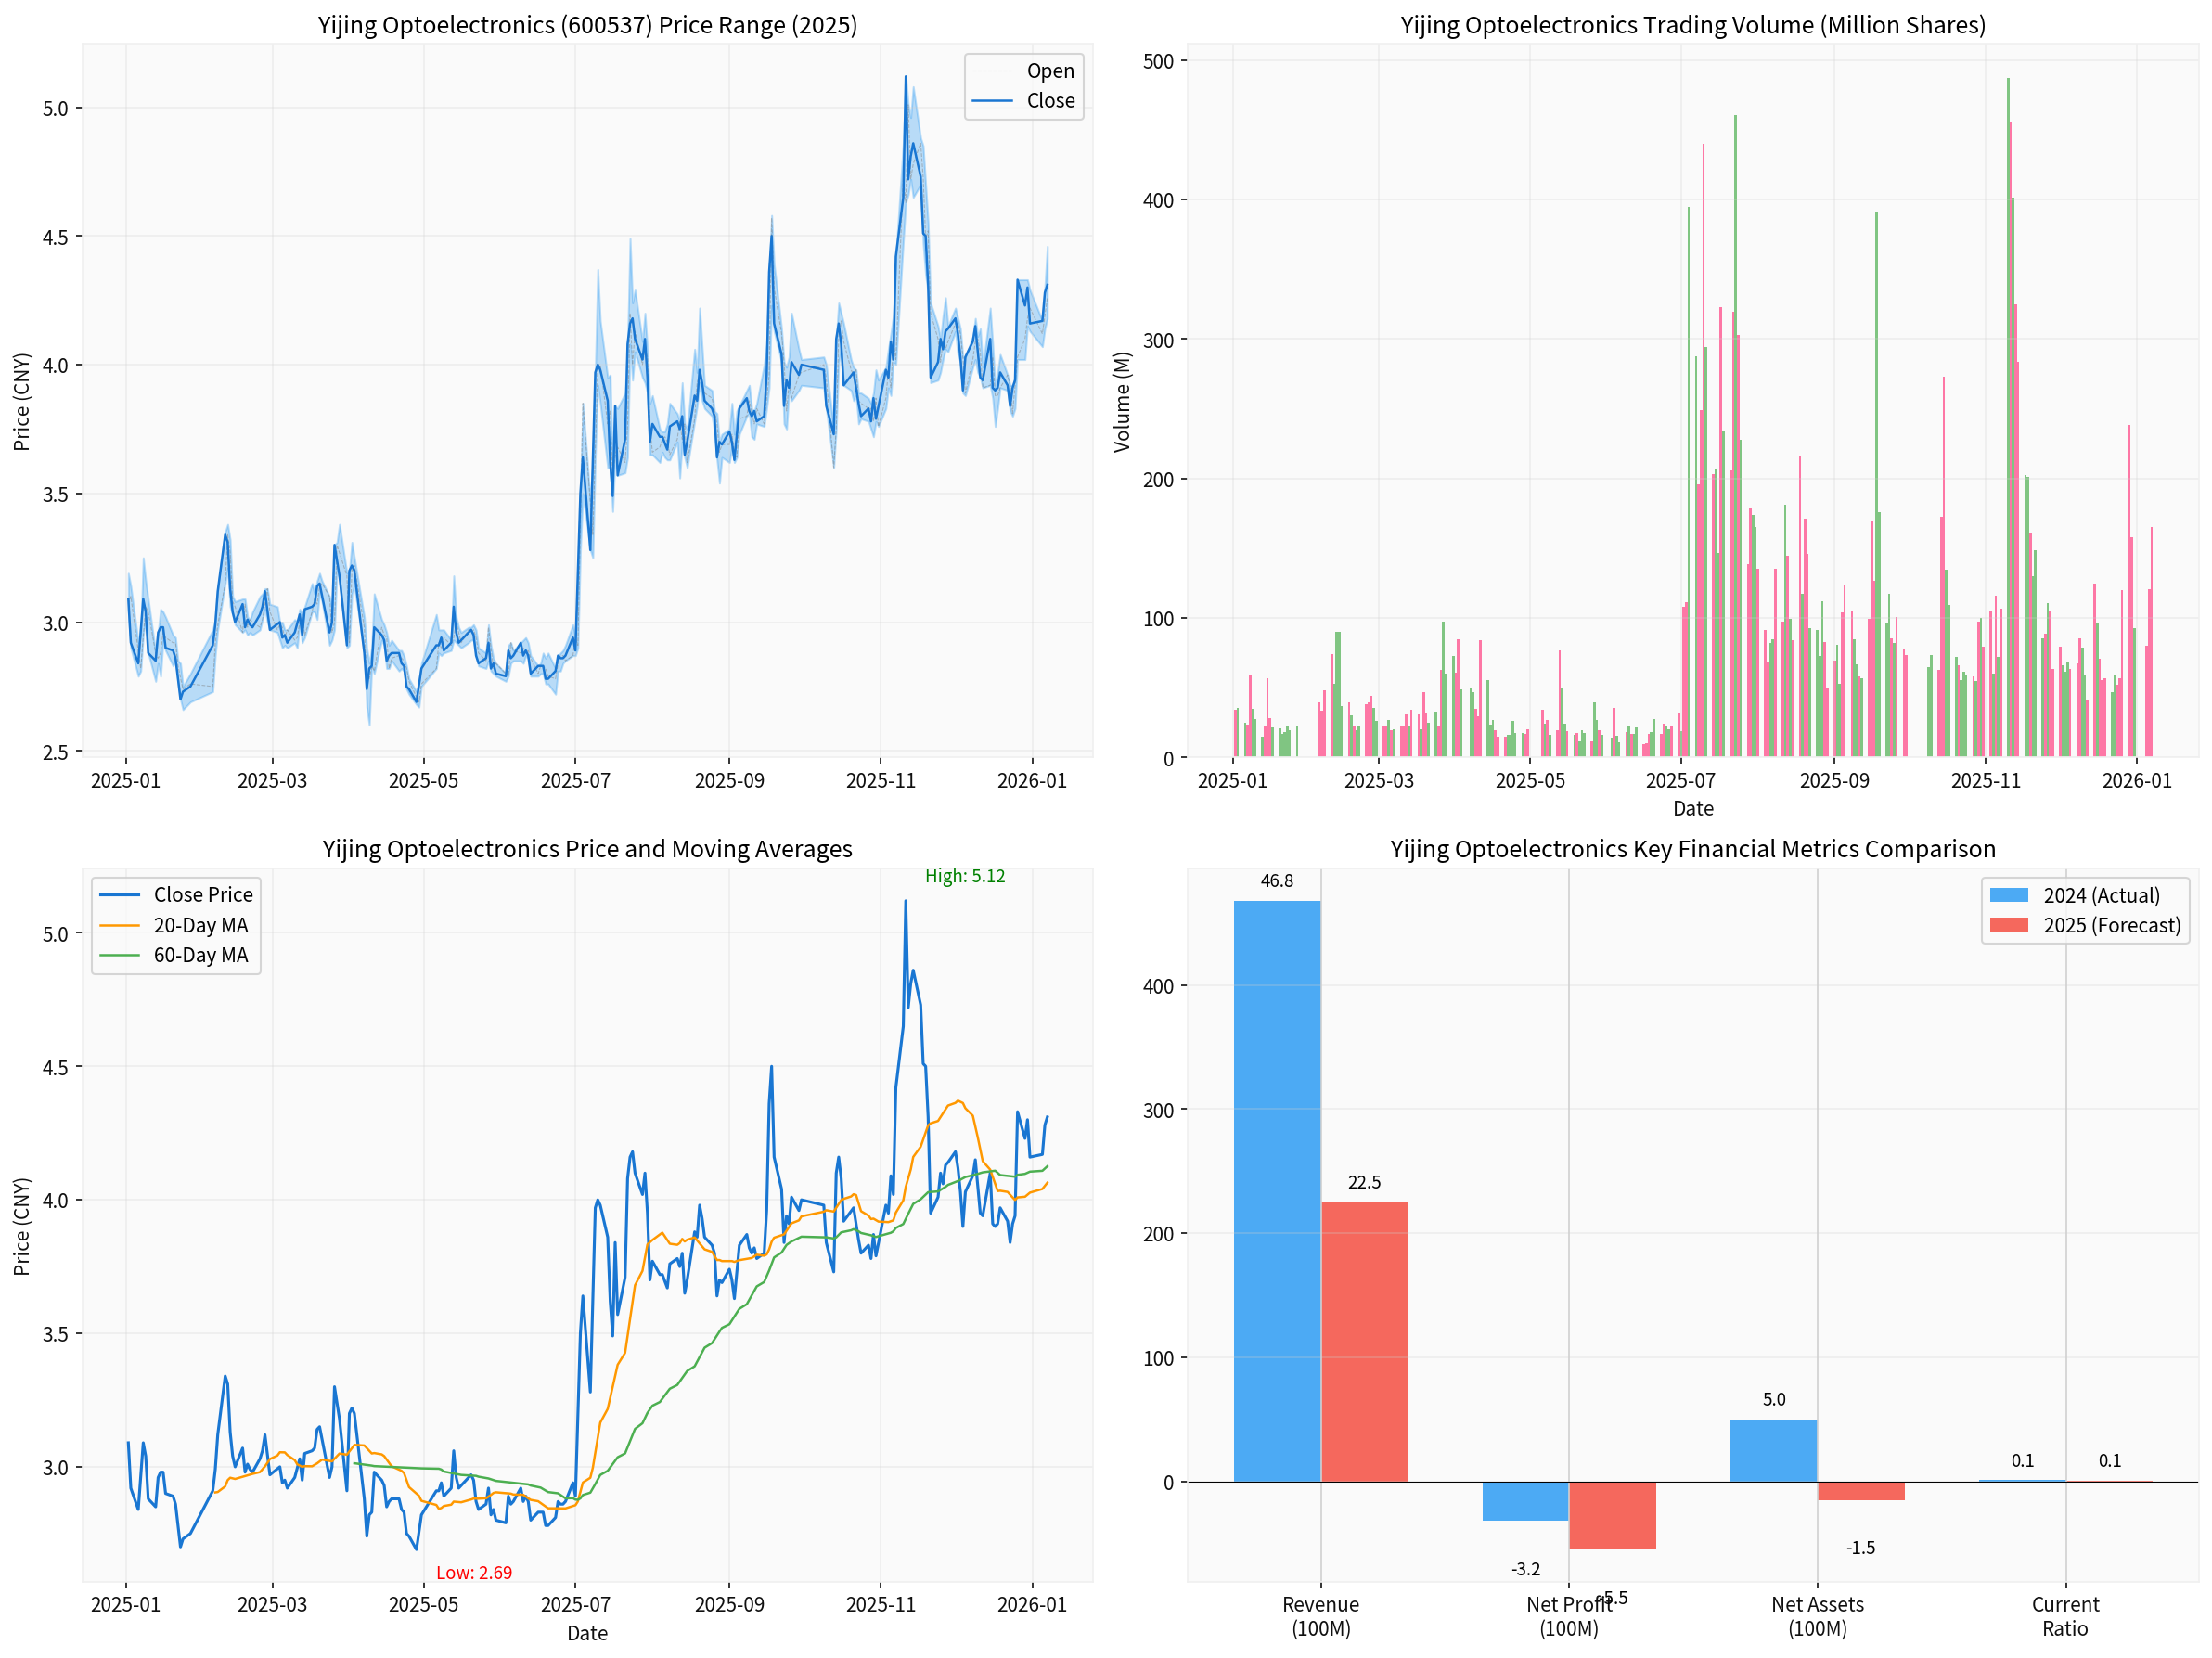
Based on technical analysis results[0]:
| Indicator | Value/Status | Signal Interpretation |
|---|---|---|
| Current Price | RMB 4.31 | Close to resistance level |
| 20-Day Moving Average | RMB 4.06 | Short-term support |
| 50-Day Moving Average | RMB 4.16 | Mid-term trend |
| Trend Judgment | Sideways/No Obvious Trend |
No clear buy/sell signal |
| Beta Coefficient | 0.43 | Low correlation with the market |
| Risk Item | Current Status | Risk Level |
|---|---|---|
| Negative Net Assets | Almost Certain |
🔴 Extremely High |
| *ST Risk | High Probability of Triggering |
🔴 Extremely High |
| Delisting Risk | Negative net assets will trigger *ST; subsequent outcome depends on whether net assets can turn positive | 🟠 High |
- Loss of Profitability: ROE of -520% and operating profit margin of -85.69% indicate that the company can no longer create value through normal operations
- Cash Flow Exhaustion: Free cash flow is negative and continues to outflow
- Liquidity Crisis: Current ratio <1, with significant financial pressure
- Deteriorating Asset Quality: Failed project investments and frequent legal disputes
- Cliff-Like Revenue Drop: 42.58% year-on-year decline in revenue in the first three quarters of 2025
Yijing Optoelectronics has proposed the following response strategies[1]:
- Accelerate financial accounting work and disclose the 2025 annual report as soon as possible
- Continuously track cutting-edge industry technology trends and focus on technological iteration
- Accelerate the introduction of new materials and technologies with leading carbon values
- Promote green energy innovation business
- Continue to carry out cost reduction and efficiency improvement work, revitalize and enhance asset value
- Enhance capital liquidity
| Risk Type | Description |
|---|---|
Delisting Risk |
Negative net assets will trigger *ST, which may lead to further delisting |
Liquidity Risk |
Current ratio <1, with enormous financial pressure |
Industry Risk |
Persistent overcapacity in the photovoltaic industry, with uncertainty from price wars |
Execution Risk |
Significant uncertainty regarding the effectiveness of the company’s response measures |
[1] Sina Finance - “Former Photovoltaic Leader Yijing Optoelectronics’ End-of-2025 Net Assets May Be Negative, May Face *ST Status” (https://finance.sina.com.cn/roll/2026-01-08/doc-inhfpfxi7235742.shtml)
[2] Sina Finance - “Yijing Optoelectronics: Expects 2025 Annual Net Profit to Be Negative” (https://finance.sina.com.cn/7x24/2026-01-07/doc-inhfnvim4568655.shtml)
[3] Securities Times - “2025 Photovoltaic Industry Battle: From Price Slaughter to Value Reconstruction” (https://www.stcn.com/article/detail/3550235.html)
[4] Sina Finance - “2025 Photovoltaic Industry Battle: From Price Slaughter to Value Reconstruction” (https://finance.sina.com.cn/money/bond/2025-12-22/doc-inhcrpzq9384274.shtml)
[5] Guanyan Tianxia - “2025 China Photovoltaic Industry Bids Farewell to Price Wars, Moves Towards a New Stage of Value Competition” (https://m.chinabaogao.com/detail/774163.html)
[0] Jinling API Data
Insights are generated using AI models and historical data for informational purposes only. They do not constitute investment advice or recommendations. Past performance is not indicative of future results.
About us: Ginlix AI is the AI Investment Copilot powered by real data, bridging advanced AI with professional financial databases to provide verifiable, truth-based answers. Please use the chat box below to ask any financial question.