In-Depth Investment Analysis Report on Banc of California (BCAL): Drivers of 52-Week Stock Price High and Valuation Analysis
Unlock More Features
Login to access AI-powered analysis, deep research reports and more advanced features

About us: Ginlix AI is the AI Investment Copilot powered by real data, bridging advanced AI with professional financial databases to provide verifiable, truth-based answers. Please use the chat box below to ask any financial question.
Related Stocks
I have now collected sufficient data, and below is an in-depth analysis report on Banc of California (BCAL) hitting a 52-week stock price high.
| Indicator | Value |
|---|---|
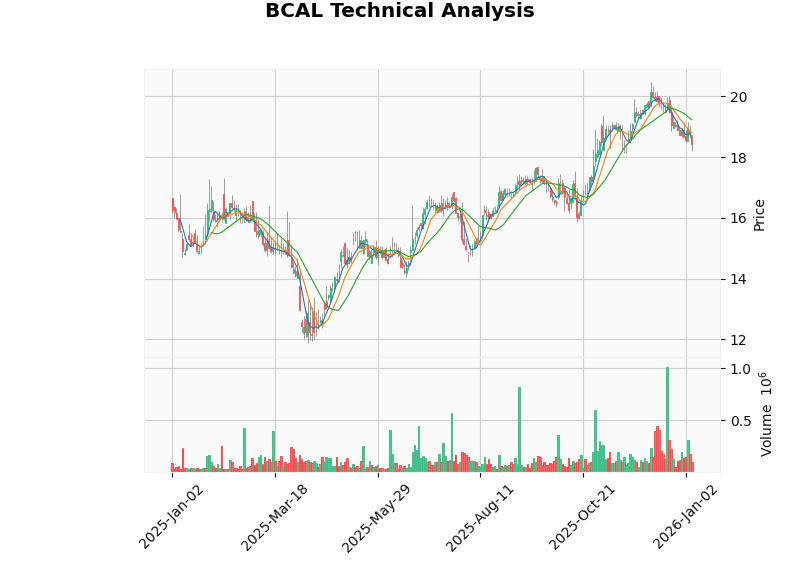
| Closing Price | $18.43 |
| 52-Week Range | $11.87 - $20.47 |
| Distance from 52-Week High | -8.42% |
| Gain from 52-Week Low | +29.73% |
| Market Capitalization | $597 million |
| P/E (TTM) | 8.50x |
| P/B | 1.07x |
| Beta | 0.27 |
| Period | Return Rate |
|---|---|
| 5-Day | -1.42% |
| 1-Month | -6.14% |
| 3-Month | +9.60% |
| 6-Month | +12.20% |
| 1-Year | +17.80% |
BCAL delivered better-than-expected results in Q3 2025[0][2]:
| Financial Indicator | Actual Value | Consensus Estimate | Beat Margin |
|---|---|---|---|
| EPS | $0.48 | $0.39 | +23.08% |
| Revenue | $59.86 million | $45.40 million | +31.84% |
- Net Interest Income: Reached $42.51 million in Q3, representing a 15.1% YoY increase
- Loan Loss Provision Recoveries: Recorded recoveries for the third consecutive quarter, with $15,000 recovered in Q3, indicating continuous improvement in credit quality
- Non-Interest Income: Surged 127% YoY to $2.67 million
- Net Profit: $15.68 million, compared to a net loss of $16.46 million in the same period last year (primarily affected by merger-related expenses)
On July 31, 2024, BCAL completed a merger of equals with California BanCorp (CALB)[2][3]:
- Scale Effect: Total assets exceeded $4 billion post-merger, with a loan portfolio of $3 billion
- Expanded Geographic Coverage: Expanded from Southern California to Northern California, adding 14 branches and 4 loan offices
- Strengthened Deposit Base: Total deposits increased to $3.46 billion, with a higher proportion of low-cost core deposits
- Cost Synergies: Improved operational efficiency through business integration
The company’s CEO transition announcement indicates that post-merger integration has been successfully completed, with David Rainer assuming the CEO position on December 31, 2025[4][5].
This is a key fundamental factor driving the stock price increase[2][6]:
| Credit Indicator | As of September 30, 2025 | As of December 31, 2024 | Change |
|---|---|---|---|
| Non-Performing Assets/Total Assets | 0.38% | 0.76% | -50% |
| 30-59 Day Past-Due Loans | $2.78 million | $6.27 million | -55.7% |
| 60-89 Day Past-Due Loans | $0.37 million | $5.81 million | -93.6% |
| Special Mention Loans | $98.42 million | $69.34 million | +42% |
| Substandard Loans | $84.66 million | $11.76 million | -28% |
- Loan Loss Provisions: $41.29 million
- Loan Loss Coverage Ratio: Adequate, with credit risks continuing to decline
Regional banks rebounded overall in 2025, with BCAL emerging as a key beneficiary[7][8][9]:
- Fed Interest Rate Cut Cycle: A total of 75 basis points in rate cuts were implemented in 2025, shifting the interest rate environment from tight to loose
- Decline in Deposit Costs: Interest expenses on time deposits fell from $5.09 million in the same period last year to $1.40 million (Q3)
- Relieved Net Interest Margin (NIM) Pressure: NIM pressure eased as deposit costs declined and loan yields remained relatively stable
- Reduced Impairment on Bond Portfolio: The 10-year Treasury yield fell from 4.6% at the end of 2024 to 4.2%, reducing unrealized losses
| Capital Indicator | Value |
|---|---|
| Tier 1 Capital Adequacy Ratio | Strong (far exceeding regulatory requirements) |
| Risk-Weighted Capital/Commercial Real Estate Loans | 466% (above the 300% threshold but manageable) |
| Liquidity Coverage Ratio | Adequate |
In the MD&A, management emphasized that the company can maintain “capital adequacy levels far exceeding regulatory requirements” even under interest rate stress test scenarios[2].
| Scenario | Valuation | Upside from Current Price |
|---|---|---|
| Conservative Scenario | $32.71 | +77.4% |
| Base Scenario | $40.38 | +119.0% |
| Optimistic Scenario | $57.39 | +211.3% |
| Weighted Average | $43.49 | +135.9% |
- WACC (Weighted Average Cost of Capital): 12.1%
- 5-Year Revenue CAGR: 35.8% (historical average)
- Terminal Growth Rate: 2.0%-3.0%
- Cost of Equity (CAPM): 6.4%
| Rating | Number of Analysts |
|---|---|
| Buy | 2 (66.7%) |
| Hold | 1 (33.3%) |
| Price Target Range | $19.00 - $21.00 |
| Average Price Target | $20.00 |
| Premium to Current Price | +8.5% |
- October 31, 2025: Keefe, Bruyette & Woods maintained an “Outperform” rating, raising the price target from $19 to $21
- July 29, 2025: Stephens & Co. maintained an “Equal Weight” rating
From a relative valuation perspective:
- P/E (TTM): 8.5x, lower than the regional banking industry average (approximately 12-15x)
- P/B: 1.07x, in the historical low range
- Implied Upside: DCF valuation shows 77%-211% upside potential
| Indicator | Value | Signal Interpretation |
|---|---|---|
| MACD | No Crossover | Neutral-Bearish |
| KDJ | K:22.0, D:17.7, J:30.7 | Buy Signal |
| RSI (14-Day) | Normal Range | Neutral |
| Trend Judgment | Sideways Consolidation | No Clear Direction |
| Support Level | $18.22 |
|---|---|
| Resistance Level | $19.23 |
| Current Trading Range | Sideways Consolidation |
The regional banking sector performed strongly overall in 2025, driven by the following key factors:
- Shift in Interest Rate Expectations: The market shifted from fearing rate hikes to anticipating a rate cut cycle
- Eased Deposit Competition: Deposit costs began to decline
- Stable Credit Quality: Commercial real estate exposure is manageable
- Valuation Recovery: Previous oversold conditions led to increased valuation attractiveness
- The Fed’s quantitative tightening policy ended on December 1, 2025, injecting liquidity into the market[2]
- Regulatory environment is expected to loosen; Fitch forecasts that banking regulation will become “more lenient” in 2026[9]
- The Trump administration may relax financial regulations
BCAL’s exposure to CRE risks warrants attention:
| Indicator | Value | Regulatory Threshold |
|---|---|---|
| CRE Loans/Risk Capital | 466% | 300% |
| Construction and Development Loans/Risk Capital | 35% | - |
| Non-Performing CRE Loans | $13.60 million | - |
- Although CRE exposure exceeds the regulatory threshold of concern (300%), the company has implemented the following risk control measures:
- Significantly reduced the Sponsor Finance portfolio
- Reduced reliance on broker deposits
- Continuously improved loan portfolio quality
- CRE loans account for a high proportion of total loans, facing pressure during the office real estate downturn cycle
- Approximately 49% of deposits exceed FDIC insurance limits, posing customer concentration risk[2]
- California Economic Slowdown: UCLA forecasts California’s GDP growth to be 1.4% in 2025 and drop to 1.1% in 2026[2]
- Tariff policy uncertainty may impact the operations of corporate clients
- Government shutdowns restrict access to economic data, increasing uncertainty
- Although deposit costs have declined, loan yields may come under pressure as interest rates fall
- Intensified competition may compress net interest margins
- The new CEO’s leadership style and strategic direction require observation
- Post-merger cultural integration and business synergies still need to be verified
- Continuous Fundamental Improvement: Improved credit quality, expanded profit margins, and revenue growth
- Attractive Valuation: P/E ratio is only 8.5x, lower than historical averages and peers
- Favorable Interest Rate Environment: Deposit costs are declining faster than loan yields during the rate cut cycle
- Capital Return Capability: ROE reaches 11.77%, with sustainable profitability
- Technical Pressure: Currently near the $19.23 resistance level, may consolidate sideways in the short term
- Market Volatility: Valuation recovery for the overall regional banking sector may have been partially completed
- Commercial Real Estate Risk: CRE exposure remains a potential hidden danger
- Management Transition Period: The new CEO needs time to prove their capabilities
| Factor | Assessment |
|---|---|
| Fundamental Support | Strong |
| Valuation Attractiveness | Strong |
| Technical Momentum | Neutral |
| Risk Controllability | Moderately Strong |
Overall Sustainability |
Moderately Strong |
Banc of California (BCAL)’s 52-week stock price high is driven by
- Better-Than-Expected Earnings: Both Q3 EPS and revenue significantly beat consensus estimates
- Successful Merger Integration: Scale effects and cost synergies are beginning to emerge
- Improved Credit Quality: Recorded loan loss provision recoveries for three consecutive quarters
- Favorable Interest Rate Environment: Net interest margin pressure eased during the rate cut cycle
- Valuation Recovery: Rebounding from extreme undervaluation to reasonable valuation
- Current Price($18.43) vsDCF Base Scenario Valuation($40.38):Significantly Undervalued
- Median Analyst Price Target($20.00): 8.5% premium to current price
- Reasonable Valuation Range: $25-$35 (based on conservative to neutral scenarios)
| Strategy Type | Recommendation |
|---|---|
| Long-Term Value | Accumulate on dips, price target $25-$30 |
| Medium-Term Trading | Wait for a breakout above the $19.23 resistance level before entering |
| Risk Preference | Conservative investors who can accept CRE risks |
- February 4, 2026: Q4 FY2025 earnings report (consensus EPS estimate: $0.44)
- 2026: Further interest rate cuts by the Fed
- Management Stability: Disclosure of the new CEO’s strategic plan
- Loan Growth: Business expansion drives scale growth
BCAL’s stock price increase
It is recommended that investors
[0] Jinling API - Real-Time Quotes and Company Profile Data
[1] Yahoo Finance - California BanCorp (BCAL) Stock Price, Quote & Analysis (https://finance.yahoo.com/quote/BCAL/)
[2] SEC Filing - California BanCorp 10-Q Filing (2025-11-07) (https://www.sec.gov/Archives/edgar/data/1795815/000179581525000021/bcal-20250930.htm)
[3] Seeking Alpha - California BanCorp: A High-Performing Bank In The Golden State (https://seekingalpha.com/article/4853243-california-bancorp-a-high-performing-bank-in-the-golden-state)
[4] GlobeNewswire - California BanCorp Announces Retirement of CEO Steven Shelton and Appointment of David Rainer as CEO (https://www.globenewswire.com/)
[5] StockTitan - California BanCorp (BCAL) names David Rainer CEO (https://www.stocktitan.net/news/BCAL/)
[6] Parkview Insights - Impact Of Regional Banking Stress On CRE Lending (https://www.parkviewfinancial.com/post/parkview-insights-impact-of-regional-banking-stress-on-cre-lending)
[7] Yahoo Finance - Regional Bank Rebound: 3 Overlooked Banks to Watch in 2026 (https://finance.yahoo.com/news/regional-bank-rebound-3-overlooked-165400393.html)
[8] Investing.com - Regional & Mid-Cap Bank Stocks to Watch in 2026 (https://www.investing.com/news/stock-market-news/regional--midcap-bank-stocks-to-watch-in-2026-as-per-jefferies-93CH-4421466)
[9] International Banker - Stability Is Broadly Expected for Global Banking in 2026 (https://internationalbanker.com/banking/stability-is-broadly-expected-for-global-banking-in-2026-but-beware-of-key-risks/)
[10] Jinling API - DCF Valuation Analysis Data
[11] Jinling API - Technical Analysis Data
[12] Agora - Commercial Real Estate Lending Trends in 2026 (https://agorareal.com/blog/commercial-real-estate-lending-trends/)
[13] CNBC - Here’s what to expect for commercial real estate in 2026 (https://www.cnbc.com/2025/12/30/commercial-real-estate-2026-what-to-expect.html)
Insights are generated using AI models and historical data for informational purposes only. They do not constitute investment advice or recommendations. Past performance is not indicative of future results.
About us: Ginlix AI is the AI Investment Copilot powered by real data, bridging advanced AI with professional financial databases to provide verifiable, truth-based answers. Please use the chat box below to ask any financial question.