Analysis Report
Unlock More Features
Login to access AI-powered analysis, deep research reports and more advanced features
About us: Ginlix AI is the AI Investment Copilot powered by real data, bridging advanced AI with professional financial databases to provide verifiable, truth-based answers. Please use the chat box below to ask any financial question.
Related Stocks
Based on the latest market data and in-depth analysis, I will provide a comprehensive breakdown of the implications of the current divergence in the performance of large-cap tech stocks for portfolio allocation.
Based on real-time trading data[0], large-cap tech stocks show clear divergence:
- Nvidia (NVDA): $192.12, +2.13%
- Intel (INTC): $39.70, +0.84%
- Microsoft (MSFT): $472.46, -0.08% (relatively resilient)
- Tesla (TSLA): $436.84, -3.28% (top loser)
- Apple (AAPL): $264.16, -1.16%
The overall market performance is stable[0]:
- S&P 500: -0.01%
- NASDAQ: -0.13%
- Dow Jones: +0.08%
- Russell 2000: +0.03%
Sector performance data[0] shows that capital is flowing from the tech sector to traditional value sectors:
- Industrial Sector: +2.34% (top gainer)
- Financial Sector: +2.21%
- Technology Sector: -0.31% (one of the only declining sectors)
- Energy Sector: -2.64% (top loser)
Based on technical analysis data[0] and chart analysis[0]:
| Indicator | Tesla (TSLA) | Nvidia (NVDA) |
|---|---|---|
Current Price |
$436.84 | $192.12 |
Daily Change |
-3.28% | +2.13% |
Beta Value |
1.88 (high volatility) | 2.31 (extremely high volatility) |
Trend Status |
Sideways consolidation, support level at $429.51 | Sideways consolidation, resistance level at $194.00 |
MACD |
Bearish | Bullish |
KDJ |
Oversold territory (potential rebound) | Bearish |
P/E Ratio |
267.69 (extremely high valuation) | 47.03 (high but reasonable) |
- Market Cap: $1.41 trillion
- ROE: 6.91% (relatively low)
- Net Profit Margin: 5.51%
- Business Structure: Automotive (75.5%) + Services (12.4%) + Energy (12.2%)
- Latest Earnings Report (2025 Q3): EPS missed estimates, revenue exceeded estimates[0]
- European Market Pressure: BYD outsold Tesla in key European markets[1]
- Market Cap: $4.67 trillion (far exceeding Tesla)
- ROE: 1.04% (due to large-scale investments)
- Net Profit Margin: 53.01% (ultra-high profitability)
- Business Structure: Data Center (87.9%) + Gaming (9.2%)
- Latest Earnings Report (2026 Q3): Both EPS and revenue exceeded estimates[0]
- Strong AI Demand: Unveiled GeForce Now for Fire TV and G-Sync Pulsar technology at CES[1]
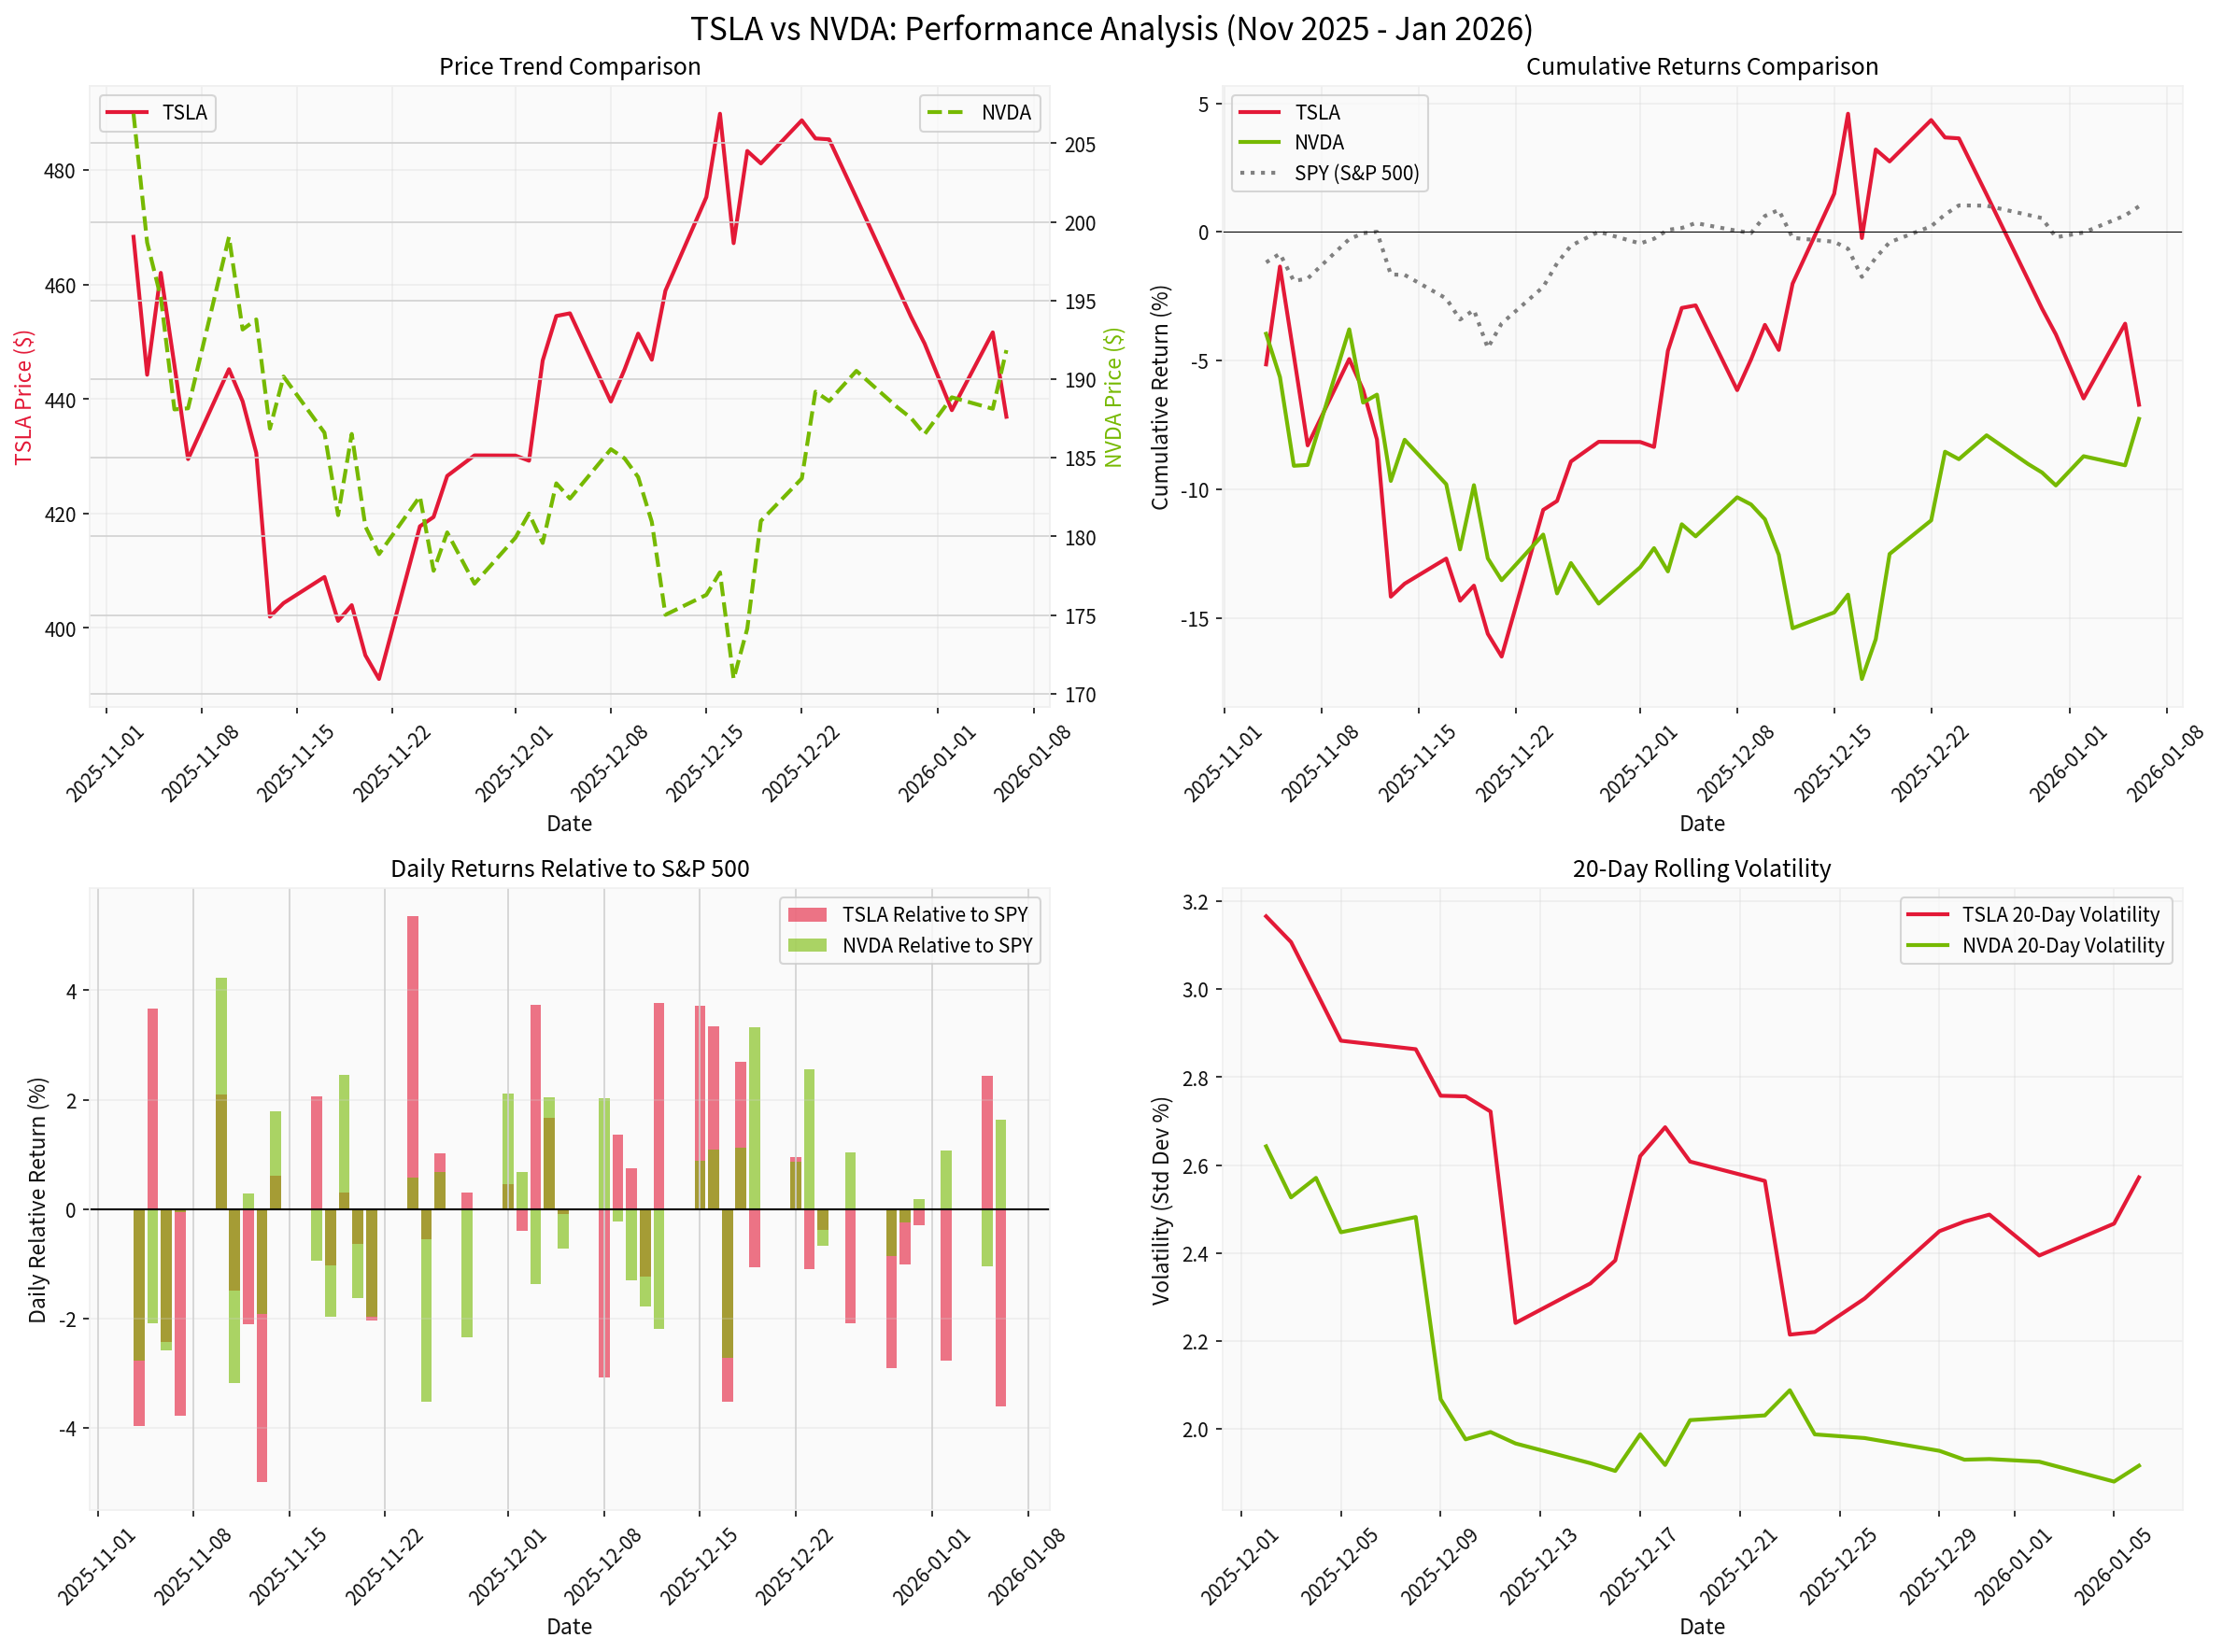
Based on data analysis[0]:
- TSLA-NVDA Correlation: 0.390 (moderate positive correlation)
- Performance in the Past 2 Months: TSLA -6.71%, NVDA -7.27% (both declined, but diverged today)
- Volatility: TSLA daily volatility 2.84%, NVDA daily volatility 2.27%
- Maximum Drawdown: TSLA -16.50%, NVDA -17.37%
Based on market data analysis[0], the current market exhibits
- From high-valuation tech stocks → traditional value sectors
- From growth stocks → cyclical stocks
- From high-Beta stocks → low-Beta stocks
Based on the latest news and market trends[1]:
- Intensified competition in the European market (BYD’s overtaking)
- Slowing growth in electric vehicle demand
- Elon Musk’s diversification strategy diverts investor attention
- Extremely high valuation (P/E 267x) creates valuation pressure
- Sustained strong demand for AI chips
- Explosive growth in data center business
- New product releases at CES boosted market sentiment
- Relatively reasonable valuation (P/E 47x)
- Yes, there are clear short-term rotation opportunities
- Capital is flowing from high-valuation tech stocks to reasonably valued AI-related stocks
- Demand for defensive allocation is increasing
- Structural divergence within the tech sector, rather than a full exit from tech stocks
- AI infrastructure (chips, cloud services) vs. application layer (electric vehicles, consumer electronics)
- Fundamentals will be the key driver of divergence
- Avoid excessive concentration in a single tech stock
- Allocate evenly between AI infrastructure and application layer stocks
- Add defensive sectors for hedging
| Allocation Category | Recommended Proportion | Target Selection | Rationale |
|---|---|---|---|
| AI Infrastructure | 30-35% | NVDA, AMD | Beneficiary of long-term AI trends, relatively reasonable valuation[0] |
| Tech Giants | 25-30% | MSFT, GOOGL | Stable cash flow, comprehensive AI deployment |
| Growth Potential | 15-20% | TSLA (at low levels) | Potential rebound after oversold, KDJ indicates oversold condition[0] |
| Defensive Sectors | 10-15% | Industrial Sector (XLI), Financial Sector (XLF) | Hedge against tech stock volatility |
| Cash/Fixed Income | 5-10% | - | Maintain liquidity |
| Allocation Category | Recommended Proportion | Target Selection | Rationale |
|---|---|---|---|
| High-Quality Tech ETFs | 30% | QQQ, VGT | Diversify individual stock risk |
| AI-Themed ETFs | 20% | BOTZ, AIQ | Focus on AI-related stocks |
| Value Stocks | 25% | Industrial Sector, Financial Sector | Current top-performing sectors[0] |
| Bonds/Fixed Income | 15% | - | Reduce portfolio volatility |
| Cash | 10% | - | Wait for opportunities to add positions |
- Tech stock allocation should not exceed 20%
- Allocate over 60% to defensive sectors (utilities, consumer staples, healthcare)
- Allocate over 20% to bonds and cash
- Short-Term: Technically oversold[0], a technical rebound may occur, but chasing the rally is not recommended
- Mid-Term: Pay attention to the Q4 earnings report on February 4, 2026[0]; if results miss estimates, it may continue to face pressure
- Strategy: Wait for a clear stabilization signal (break above the $463.27 resistance level) before considering entry
- Short-Term: Strong performance[0], but approaching the $194.00 resistance level[0], a short-term pullback may occur
- Mid-Term: Strong AI demand, the Q4 earnings report on February 25, 2026 is worth paying attention to[0]
- Strategy: Consider accumulating positions in batches when it pulls back to around the $183.65 support level[0]
- Valuation Risk: TSLA’s extremely high valuation (P/E 267x) places extremely high demands on its performance
- Policy Risk: Changes in the Federal Reserve’s monetary policy have a significant impact on high-Beta tech stocks
- Competition Risk: Intensified competition in the electric vehicle and AI chip markets
- Economic Cycle Risk: An economic recession will impact tech stock earnings
-
TSLA Focus:
- Q4 Earnings Report (February 4): Expected EPS $0.46, expected revenue $24.81 billion[0]
- Changes in European market share
- New model delivery data
-
NVDA Focus:
- Q4 Earnings Report (February 25): Expected EPS $1.52, expected revenue $65.57 billion[0]
- Sustainability of AI data center demand
- Product progress of competitor AMD
-
Overall Market:
- Federal Reserve interest rate policy
- Overall valuation level of the tech sector
- Economic data (employment, inflation)
-
The divergent performance between Tesla and Nvidia does signal sector rotation opportunities, but this is astructural rotationrather than a full exit from tech stocks.
-
Rotation Characteristics: From high-valuation application-layer tech stocks (e.g., TSLA) → reasonably valued infrastructure tech stocks (e.g., NVDA) → defensive traditional sectors.
-
Allocation Implications: Portfolios should shift from “concentrated bets on high-valuation growth stocks” to “diversified allocation of high-quality tech stocks + defensive sectors.”
-
Short-Term Strategy: TSLA is technically oversold with rebound potential, while NVDA is approaching resistance levels, so caution is advised when chasing the rally.
-
Long-Term Strategy: AI infrastructure (chips, cloud) has a better risk-return ratio than the application layer (electric vehicles, consumer electronics).
- Immediate Adjustment: Reduce holdings of high-valuation tech stocks and increase allocation to defensive sectors
- Batch Position Building: Gradually increase positions in AI infrastructure targets when NVDA pulls back
- Wait for Opportunities: Wait for a clear stabilization signal before considering entry into TSLA
- Dynamic Rebalancing: Regularly adjust portfolio allocation based on market changes
[0] Jinling API Data - Includes real-time quotes, technical analysis, company profiles, historical price data, market indices, sector performance, and all other data obtained through API tools
[1] Bloomberg - “Elon Musk is already $24 billion richer this year” (https://www.businessinsider.com/elon-musk-wealth-gain-tesla-spacex-rich-list-billionaires-ai-2026-1)
[2] Seeking Alpha - “Tesla: Long-Term Dreams, Short-Term Reality” (https://seekingalpha.com/article/4857391-tesla-long-term-dreams-short-term-reality)
[3] Investing.com - “BYD outsold Tesla in two key European markets in 2025” (https://www.investing.com/news/stock-market-news/byd-outsold-tesla-in-two-key-european-markets-in-2025-4432257)
[4] Seeking Alpha - “Nvidia: Ready To Outperform In 2026 – Again (Rating Upgrade)” (https://seekingalpha.com/article/4857275-nvidia-ready-to-outperform-in-2026-again-rating-upgrade)
[5] Digital Trends - “Nvidia GeForce Now is coming to your Fire TV Stick later this year” (https://www.digitaltrends.com/gaming/nvidia-geforce-now-is-coming-to-your-fire-tv-stick-later-this-year/)
[6] Engadget - “NVIDIA’s G-Sync Pulsar tech can minimize motion blur for gamers” (https://www.engadget.com/gaming/pc/nvidias-g-sync-pulsar-tech-can-minimize-motion-blur-for-gamers-140000058.html)
Insights are generated using AI models and historical data for informational purposes only. They do not constitute investment advice or recommendations. Past performance is not indicative of future results.
About us: Ginlix AI is the AI Investment Copilot powered by real data, bridging advanced AI with professional financial databases to provide verifiable, truth-based answers. Please use the chat box below to ask any financial question.