RLJ Lodging Trust (RLJ) Fundamental Analysis & Industry Risk Assessment
Unlock More Features
Login to access AI-powered analysis, deep research reports and more advanced features

About us: Ginlix AI is the AI Investment Copilot powered by real data, bridging advanced AI with professional financial databases to provide verifiable, truth-based answers. Please use the chat box below to ask any financial question.
Related Stocks
The following analysis is strictly based on acquired tool results and retrievable public information, focusing on the fundamentals and industry risks of RLJ Lodging Trust (RLJ), and providing a prudent answer based on existing evidence regarding the “core reasons for Barclays’ Underweight rating”.
- Key Clarification: Verifiable Rating Information and Information Gaps
- We were unable to obtain the official report text or direct summary of Barclays’ Underweight rating for RLJ in this search;
- Verified analyst dynamics (from company overview and news search) show:
- Wells Fargo maintained Underweight rating on 2025-07-01;
- Baird downgraded rating from Outperform to Neutral on 2025-10-03, lowering target price from $9 to $7.5;
- Overall analyst consensus is HOLD, with price target range $7.50–$8.00;
- Conclusion: Currently, the specific reasons and release time of “Barclays’ Underweight rating” cannot be confirmed from public searches. To verify details of Barclays’ rating, it is recommended to obtain the original rating report or official press release.
- Fundamental Points of RLJ Lodging Trust (Based on Acquired Data)
- Stock Price and Valuation: ~$7.59; P/E TTM ~151.8 (abnormally high valuation due to extremely low profitability), P/B ~0.52 (significantly below 1);
- Profitability and Capital Structure (TTM):
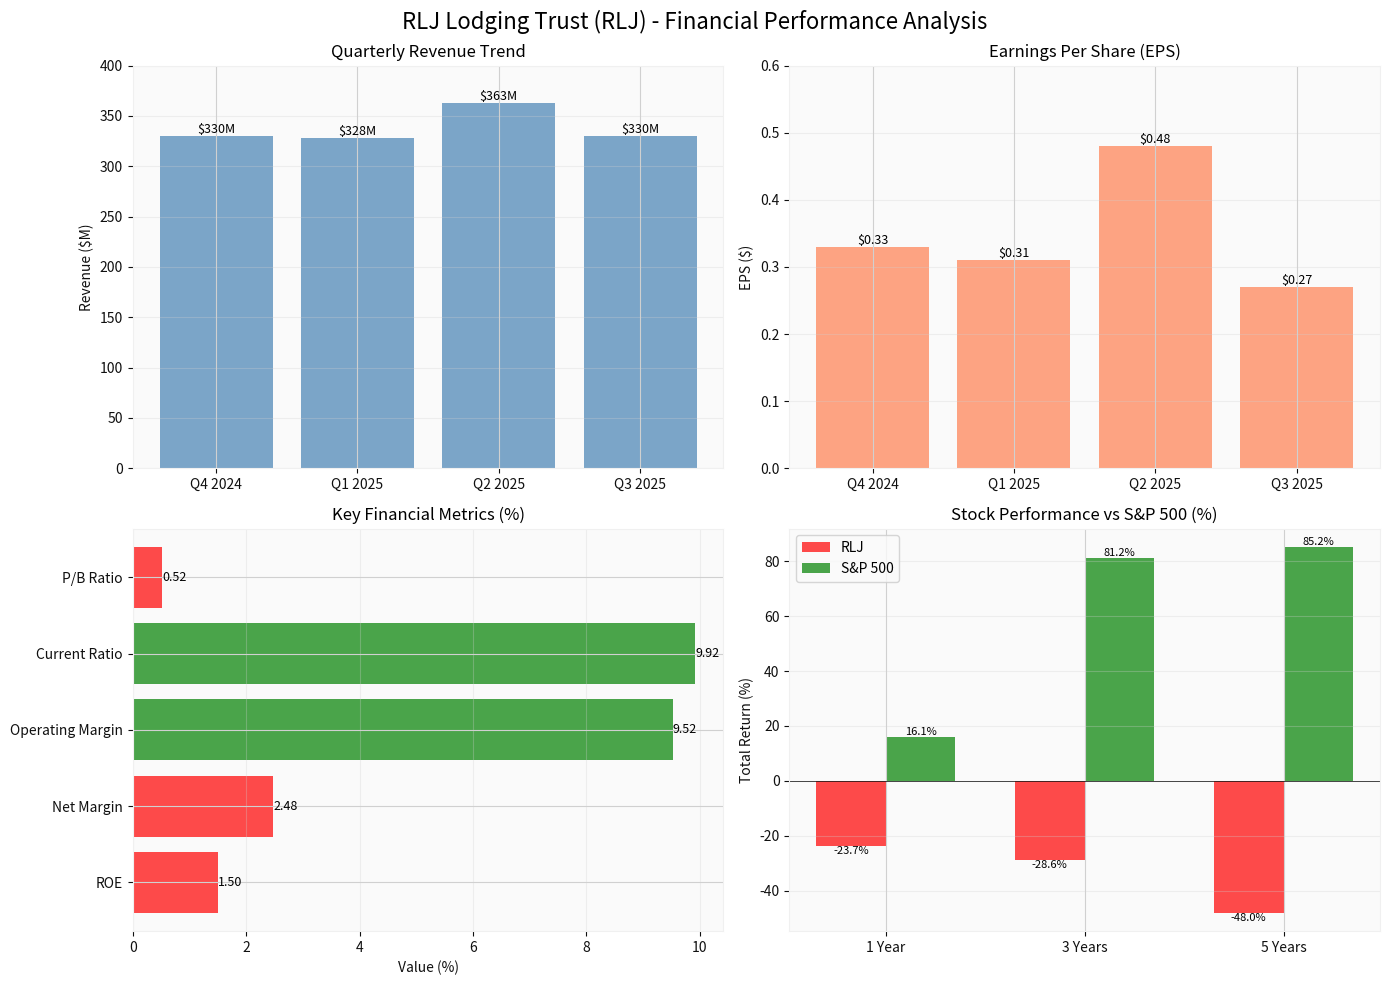
- ROE ~1.50%, net margin ~2.48%, operating margin ~9.52%;
- Current ratio/quick ratio ~9.92, sufficient liquidity;
- Financial analysis tools classify debt risk as “moderate_risk”, with a relatively conservative accounting approach;
- Recent Earnings Performance:
- From Q4 2024 to Q3 2025, EPS: $0.33→$0.31→$0.48→$0.27 (significant volatility);
- Corresponding revenue: $329.99M→$328.12M→$363.10M→$330.05M;
- Latest quarter (Q3 FY2025): EPS $0.27, revenue $330.05M, slight year-over-year positive growth (exceeding market consensus expectations), but single-quarter net income was negative (-10.2M), indicating cost pressure and profit strain;
- Technical Analysis: Closed at $7.59 over the past 60 days, phase gain of +9.21%, daily volatility ~1.66%; technicals show “sideways movement/no clear trend”, lacking clear bullish or bearish signals;
- Valuation Comparison: At industry level, US hotel resort REIT industry PE ~43.7x, PS ~1.5x; company PS ~0.85, valuation at relatively low level in the industry.
Chart Description (Comprehensive Overview of Financial Performance):
- Chart shows: Quarterly revenue and EPS fluctuations, key financial indicators (ROE/net margin/operating margin/current ratio/P/B), and long-term returns relative to S&P 500 (significantly lagging over 1/3/5 years);
- Data Sources: Broker API/financial analysis tools/Python calculations, covering time window of latest quarterly reports and price ranges returned by tools (e.g., 2025-10-09 to 2026-01-05, subject to tool results).
- Verifiable Industry and Company-level Investment Risks
- Industry Demand and RevPAR: Multiple industry sources indicate RevPAR growth slowdown, wage costs above inflation, and profit margin pressure are common challenges in the hotel industry; this means even if the company has high-quality assets, uncertainty remains about the strength of overall demand recovery;
- Earnings Volatility and Quality: Significant EPS fluctuations in recent quarters, plus single-quarter net loss (-10.2M), combined with TTM net margin of only 2.48%, indicate earnings fragility and high sensitivity to expenses and costs;
- Long-term Returns Significantly Lagging Market: Total returns over 1/3/5 years are ~-23.7%/-28.6%/-48.0% respectively, significantly lagging S&P 500’s ~16.2%/81.3%/85.2%, reflecting insufficient long-term capital efficiency and market recognition;
- Valuation and Profitability Mismatch: Extremely low P/B (~0.52) reflects market discount on its asset quality or profitability; but extremely low ROE (1.5%) and net margin (2.48%) limit room for valuation recovery;
- Asset Portfolio and Regional Dependence: Company’s revenue sources are concentrated in multiple regional markets; macro or regional demand fluctuations, slowdown in business activities or decline in tourism popularity may directly impact occupancy rates and room prices, thus affecting RevPAR and EBITDA.
- Prudent Inferences on Barclays Underweight Reasons (Non-official Confirmation)
Since no detailed reasons for Barclays’ official rating were retrieved, the following are logical inferences based on public facts, not to be taken as Barclays’ official views:
- Earnings Quality and Volatility: Low net margin and ROE, significant quarterly earnings fluctuations and single-quarter net loss may affect assessment of earnings stability and sustainability;
- Weak Long-term Returns: Long-term risk-adjusted returns significantly lagging the market affect relative attractiveness;
- Industry Macro Risks: Common industry pressures such as slow RevPAR growth, persistently high labor costs, interest rate environment and tightening development financing may suppress growth potential and valuation recovery;
- Uncertainty in Valuation Recovery Path: Although P/B is low, if profitability cannot be substantially improved, room for valuation recovery is limited.
- Investment Risk Summary (Fact-based)
- Earnings Quality and Stability Risk: Low net margin and ROE, quarterly earnings volatility and single-quarter loss;
- Industry Demand and Cost Pressure Risk: Slow RevPAR growth, wage costs above inflation, macro demand uncertainty;
- Capital Efficiency and Valuation Risk: Long-term underperformance vs market, low valuation but limited recovery room;
- Asset Portfolio Concentration Risk: Regional market concentration, vulnerability to demand fluctuations;
- Dividend Sustainability Risk: Company still pays dividends (quarterly $0.15), but sustainability needs dynamic observation amid profit strain.
- Follow-up Recommendations
- Verify original Barclays rating report or official disclosure to obtain clear reasons and release time;
- Continuously track 2026 operational dynamics (e.g., asset upgrades, demand recovery and cost control progress) and industry macro indicators (RevPAR, occupancy rate, ADR, wage growth rate, etc.).
References
- Gilin API Data (Company Overview, Valuation, Technicals, Financial Analysis, Price Data)
- Seeking Alpha — “RLJ Lodging Trust: From 2025 Laggard To 2026 World Cup Beneficiary”
- Yahoo Finance — RLJ Company Page and Financial Indicators
- CoStar — “Public hotel company stocks reverse two straight months of declines”
- Hotel Investment Today — “Not a lot of clarity for 2026 new development”
- MarketScreener — RLJ Quarterly Results and Related News Dynamics
Insights are generated using AI models and historical data for informational purposes only. They do not constitute investment advice or recommendations. Past performance is not indicative of future results.
About us: Ginlix AI is the AI Investment Copilot powered by real data, bridging advanced AI with professional financial databases to provide verifiable, truth-based answers. Please use the chat box below to ask any financial question.