Park Hotels & Resorts (PK) Investment Analysis & Hotel REITs Value in Rate Environment
Unlock More Features
Login to access AI-powered analysis, deep research reports and more advanced features

About us: Ginlix AI is the AI Investment Copilot powered by real data, bridging advanced AI with professional financial databases to provide verifiable, truth-based answers. Please use the chat box below to ask any financial question.
Related Stocks
Based on a comprehensive analysis of Park Hotels & Resorts (PK) and related data by Jinling AI, I will detail the possible investment logic behind Barclays’ ‘Overweight’ rating and evaluate the investment value of hotel REITs in the current interest rate environment.
Park Hotels & Resorts is a U.S.-based hotel-focused Real Estate Investment Trust (REIT). As of January 6, 2026:
| Key Indicators | Value |
|---|---|
| Current Stock Price | $10.57 |
| Market Capitalization | $2.11 billion |
| 52-Week Range | $8.27 - $14.11 |
| Price-to-Book Ratio (P/B) | 0.62x |
| Operating Margin | 8.44% |
| Current Ratio | 1.87 |
Although we have not found the original text of Barclays’ specific report, based on company data and market conditions, we can infer the following core investment logic:
- Below-Book Trading:The P/B ratio is 0.62x, meaning the stock price is far below the net asset value [0]. This provides investors with a significant margin of safety.
- Valuation Repair Potential:The consensus analyst target price is $12.00, representing a 13.5% upside potential from the current price [0].
- Asset Quality:The company owns high-quality hotel assets in first-tier cities, including core markets such as Hawaii, New York, Denver, and Orlando.
According to the latest news, Park Hotels is actively implementing a portfolio optimization strategy:
- Non-core Asset Disposal:The company plans to dispose of $300-400 million of non-core hotel assets between 2025 and 2026 [1].
- Historical Performance:Since 2017, the company has sold 46 hotels with a total value exceeding $3 billion, significantly reshaping its portfolio [1].
- Asset Quality Improvement:By selling underperforming assets, resources are concentrated on high-quality hotels with high growth potential.
Although Q3 2025 results were slightly below expectations, some key markets showed strong recovery:
- Hawaii Market:Hilton Hawaiian Village Waikiki Beach Resort achieved RevPAR growth of 20% and 26% in October and November, respectively [2].
- Other Core Markets:New York (+10%), Denver (+8%), and Orlando (+6%) all recorded significant growth [2].
The market expects the Federal Reserve to continue cutting interest rates in 2026 [3], which is a major positive for REITs:
- Lower Financing Costs:Reduces debt interest expenses
- Higher Asset Valuation:A decrease in discount rates pushes up net asset value
- Attractive Dividend Yield:REITs’ high dividends are more competitive in an interest rate cut environment
- Current ratio of 1.87, good short-term solvency [0]
- Operating margin of 8.44%, core business profitability is acceptable [0]
- Conservative financial attitude and prudent accounting treatment [0]
- Negative net profit margin (-0.47%), indicating profit pressure [0]
- Negative ROE (-0.34%), negative shareholder return [0]
- DCF valuation shows negative intrinsic value, indicating challenges in the current profit model [0]
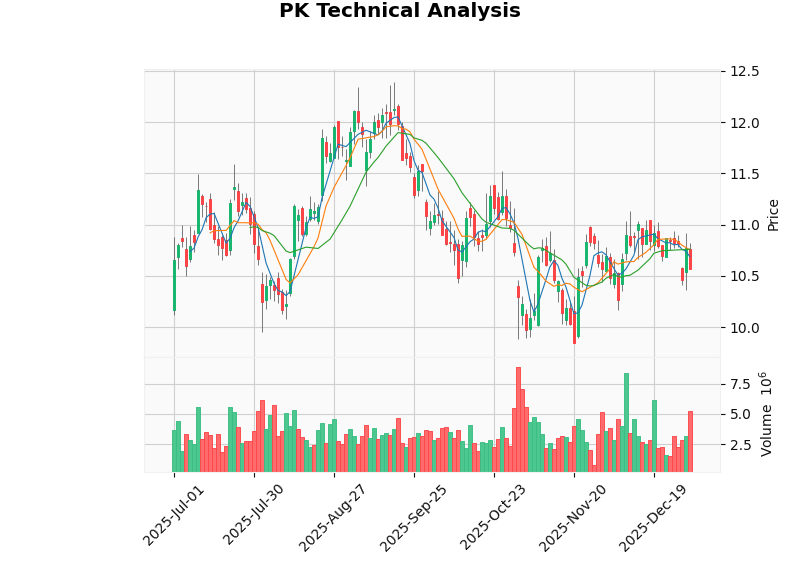
- Trend:Sideways consolidation, no clear trend direction
- Support Level:$10.43
- Resistance Level:$10.76
- Beta:1.43, higher volatility than the broader market [0]
- The market generally expects the Federal Reserve to continue its interest rate cut path in 2026 [3]
- Inflation has fallen significantly from its peak, approaching the Federal Reserve’s target level
- Interest rate cuts help reduce REITs’ financing costs
| Factor | Impact |
|---|---|
Financing Cost |
Interest rate cuts directly reduce debt interest expenses and increase net profit |
Asset Valuation |
A decrease in discount rates pushes up hotel asset valuations |
Dividend Competitiveness |
When dividend yield > bond yield, REITs’ attractiveness increases |
Capital Availability |
A loose credit environment facilitates asset acquisition and refinancing |
-
Tourism Demand Recovery:
- Business travel is gradually recovering
- Leisure travel remains strong
- International tourism recovery continues
-
RevPAR Growth:
- Average Daily Rate (ADR) increase
- Occupancy rate improvement
- Some core markets have achieved double-digit growth
-
Supply-Demand Balance:
- Limited new hotel supply
- Optimization of existing assets improves revenue quality
Investors should focus on the following when evaluating hotel REITs:
- Debt/EBITDA ratio
- Interest coverage ratio
- RevPAR growth rate
- Adjusted EBITDA margin
- Asset portfolio quality and geographic location
- Degree of brand diversification
- Lease structure (management contract vs. lease)
- P/FFO (Funds From Operations per share)
- Net Asset Value (NAV) discount/premium
- Dividend yield
- Economic Cycle Sensitivity:The hotel industry is highly dependent on the macroeconomy
- Interest Rate Volatility Risk:If interest rate cut expectations fail, valuations will come under pressure
- Rising Operating Costs:Inflation in labor, energy, and maintenance costs
- Increased Competition:New supply and alternative accommodation options
- Geopolitical Risks:Affect business and leisure travel
- Value investors: Seeking deep value opportunities from below-book trades
- Income investors: Pursuing stable dividend income (need to pay attention to dividend sustainability)
- Cyclical investors: Betting on tourism recovery and the interest rate downturn trend
- Long-term investors: Believing that the company’s asset optimization strategy will eventually pay off
- Medium to high risk tolerance
- Ability to withstand short-term volatility
- Understanding of REITs’ special tax treatment
- Monitor the progress of the company’s asset disposal and fund usage
- Monitor RevPAR recovery trends in core markets
- Wait for a clear technical breakout signal (break above the $10.76 resistance level)
- Use PK as a satellite allocation in a REIT portfolio
- Diversify risks with other types of REITs (industrial, data center, etc.)
- Control the position ratio of a single REIT (suggested not to exceed 5-10%)
- Q4 2025 financial report (expected to be released on February 18, 2026) [0]
- Progress of non-core asset sales
- Quarterly RevPAR trends
- Federal Reserve interest rate policy direction
- 2026 tourism booking data
- Company debt refinancing situation
- Results of asset portfolio transformation
- EBITDA margin improvement
- Dividend recovery and growth
The core logic behind Barclays’ ‘Overweight’ rating for Park Hotels & Resorts may be based on:
- Deep Value Investment Opportunity:Below-book trading provides significant margin of safety
- Strategic Transformation Expectation:Asset optimization will improve portfolio quality
- Interest Rate Downturn Cycle:Interest rate cut expectations will boost REITs’ valuations
- Signs of Business Recovery:Strong RevPAR growth in core markets
In the current interest rate environment, hotel REITs show investment value, but also face profit pressure and cyclical volatility risks. For investors who are optimistic about tourism recovery and the interest rate downturn trend, PK offers an attractive risk-reward ratio, but close attention needs to be paid to the progress of the company’s profitability improvement.
[0] Jinling API Data - Park Hotels & Resorts (PK) company financial data, technical analysis and market data
[1] Hotel News Resource - “Hyatt Centric Fisherman’s Wharf Hotel in San Francisco Sold for $80 Million” (https://www.hotelnewsresource.com/article136629.html)
[2] Hotel News Resource - “Park Hotels & Resorts to Sell Five Non-Core Hotels by Early 2026” (https://www.hotelnewsresource.com/article139187.html)
[3] Yahoo Finance - “3 Safer REITs That Could Raise Dividends in 2026” (https://sg.finance.yahoo.com/news/3-safer-reits-could-raise-233000172.html)
Insights are generated using AI models and historical data for informational purposes only. They do not constitute investment advice or recommendations. Past performance is not indicative of future results.
About us: Ginlix AI is the AI Investment Copilot powered by real data, bridging advanced AI with professional financial databases to provide verifiable, truth-based answers. Please use the chat box below to ask any financial question.