Investment Analysis of Barclays' Underweight Rating on Pebblebrook Hotel Trust (PEB)
Unlock More Features
Login to access AI-powered analysis, deep research reports and more advanced features

About us: Ginlix AI is the AI Investment Copilot powered by real data, bridging advanced AI with professional financial databases to provide verifiable, truth-based answers. Please use the chat box below to ask any financial question.
Related Stocks
- Pebblebrook Hotel Trust (PEB) is currently in a volatile trend, with a reference price range of $11.36-$11.73
- It has declined by approximately 14% over the past year and about 12% over the past three years, significantly underperforming the broader market index over the same period
- DCF three-scenario valuation shows that the company’s intrinsic value is far higher than the current stock price, but this method is highly dependent on growth and discount assumptions, and does not fully reflect capital structure and cash flow quality (see methodological notes later)
- Hotel REITs are highly sensitive to the interest rate environment: rising interest rates increase financing costs and suppress valuation multiples; a downward interest rate or rate cut cycle helps improve debt burden and valuation recovery
- It is recommended to comprehensively evaluate the operational quality and capital structure of individual stocks, and pay attention to timely allocation or structural overweight of leading hotel REITs around the interest rate inflection point
- Company Name: Pebblebrook Hotel Trust (PEB)
- Current Price: $11.57 (January 5, 2026; market capitalization: approximately $1.37 billion)
- 52-Week Range: $7.41-$14.21; Beta (vs. SPY): approximately 1.54
- Trend from 2024 to early 2026: Opened at $15.92 on January 2, 2024, and closed at $11.57 on January 5, 2026, with a range decline of approximately 27.3% and high volatility during the period (average daily volatility: approximately 2.49%) [0]
- Analyst Target Price: Approximately $13.00 (about 12% potential upside from current price)
- Rating Distribution (27 samples): 6 Buy (22.2%), 16 Hold (59.3%), 5 Sell (18.5%); overall HOLD [0]
- Recent Institutional Actions: Evercore ISI Group, Baird, etc. maintained Neutral/Hold; Compass Point downgraded from Neutral to Sell on November 10, 2025 [0]
- TTM Net Margin: Approximately -6.72%; TTM Operating Margin: Approximately 0.84%; TTM ROE: Approximately -3.76% [0]
- Current Ratio/Quick Ratio: Approximately 0.71, indicating liquidity pressure; need to pay attention to short-term debt and cash management [0]
- Financial Analysis Tags: Debt risk “high_risk”, accounting stance “conservative” [0]
- Recent Quarterly Performance (based on latest disclosure): Quarterly EPS reported on November 5, 2025 was $0.51, revenue was approximately $399 million; but TTM EPS remains negative (approximately -$1.18), indicating overall profit quality still needs to be repaired [0]
- Revenue Composition (latest quarter): Rooms approximately 63.9%, Food and Beverage approximately 24.1%, Others approximately 12.0% [0]
- Regional Concentration: Main markets include San Diego (approximately 24.2%), Boston (approximately 19.3%), Southern Florida/Georgia (approximately 11.7%), etc., with certain city/destination concentration characteristics [0]
- Current Stock Price: $11.57
- Conservative: Approximately $253.17 (+2088%)
- Neutral: Approximately $264.78 (+2189%)
- Optimistic: Approximately $434.26 (+3653%)
- Probability-Weighted: Approximately $317.40 (+2643%) [0]
- Historical Benchmark (5 years): Revenue CAGR approximately 34.6%, EBITDA margin approximately 11.5%, net margin approximately -25.1% [0]
- WACC/Discount: Cost of equity approximately 15.3% (Beta 1.54, risk-free rate 4.5%, MRP 7.0%), WACC approximately 7.4% [0]
- Methodological Points:
- This DCF does not directly incorporate capital structure pressure and refinancing risk (impact of high leverage and rising interest rates on net interest expense and capitalization rate);
- Historical high growth may be related to mergers and acquisitions or cyclical recovery, which may not be extrapolated to long-term sustainable growth;
- Valuation significantly higher than market price suggests that the market price may have already incorporated较多 discount (such as risk premium and capital structure discount); it should be comprehensively calibrated with FFO/NAV, peer multiples, and scenario sensitivity when used.
- Trend: Volatile, trading reference range $11.36-$11.73; no obvious one-way trend, lack of clear buy/sell signals [0]
- Technical Indicators: KDJ bullish, MACD no clear crossover (bearish), RSI in normal range, mixed bullish and bearish signals overall [0]
- Medium-Term Moving Averages: 20-day approximately $11.36, 50-day approximately $11.11, 200-day approximately $10.38; current price is close to short-term moving average support, upper resistance level approximately $11.73 [0]
- Host Hotels & Resorts (HST): Market capitalization approximately $12.46 billion; TTM net margin 12.43%, operating margin 13.81%, ROE 11.12%; P/E TTM approximately 17.0x; stock price performance over the past year +4.86%, cumulative over five years +22.85% [0]
- Choice Hotels International (CHH): Market capitalization approximately $4.60 billion; TTM net margin 23.93%, operating margin 29.20%, ROE 106.64%; P/E TTM approximately 11.98x; stock price performance over the past year -29.69%, cumulative over five years -8.82% [0]
- Comparison Points:
- Profitability and Returns: PEB’s TTM net margin and ROE are significantly weaker than leading hotel REITs like HST, indicating gaps in profit quality and asset return levels;
- Valuation Multiples: PEB’s P/B is approximately 0.54, with a significant book value discount; but combined with negative profit margin and leverage risk, the market may give a double repricing of “quality discount + valuation discount”;
- Stock Price Resilience: PEB has a negative cumulative return over the past three years, while HST is positive, showing that capital preference is concentrated on leading, more stable hotel REITs.
- High leverage is sensitive to interest rates: Public information indicates that PEB has high debt risk (“high_risk”) [0]; rising/high interest rates will push up refinancing costs and interest expenses, compressing net cash flow;
- REITs usually use a high proportion of floating-rate debt or roll over refinancing after short-term maturity; rising interest rates directly erode distributable cash;
- Expectation of interest rate cut cycle (some markets expect further rate cut space in 2026) is expected to improve financing costs and promote valuation recovery, but need to evaluate each company’s debt duration and refinancing schedule (specific refinancing/interest rate distribution not obtained in this round of data; it is recommended to supplement with quarterly/annual reports).
- Hotel asset valuation is highly sensitive to capitalization rate; falling interest rates usually push up asset prices and NAV, forming a positive pull on hotel REITs;
- Rising interest rates are the opposite, which may trigger NAV downgrades and valuation multiple compression.
- Business and leisure demand are affected by macro and interest rate cycles: Rising interest rates suppress corporate and residential spending, which may suppress occupancy rates (OCC) and average daily rates (ADR), thereby affecting RevPAR;
- Comparison with the broader market over the same period: From August 27, 2025 to January 5, 2026 (past 90 days), the S&P 500, Nasdaq, Dow Jones, and Russell 2000 rose by approximately 6.81%, 8.68%, 7.84%, and 8.24% respectively, while the hotel REIT sector performed weaker [0], reflecting that market concerns about profitability and refinancing risks remain high.
Note: Since the original text or key arguments of Barclays’ Underweight rating on PEB were not directly obtained in this round, the following is a core factor framework of “possible reasons leading to institutions being relatively cautious or underweight” based on the obtained public data and indicators, rather than a specific repetition of the unobtained report.
- Profit Quality: Negative TTM net margin and ROE; profit recovery and distributable cash flow are still unstable, suppressing valuation confidence [0]
- Leverage and Liquidity: High debt risk label, current ratio below 1, indicating short-term refinancing and liquidity pressure, high sensitivity to interest rates [0]
- Industry Comparison: Compared with leading hotel REITs (such as HST), PEB has gaps in profitability and return quality; capital prefers stable operators [0]
- Capital Structure Discount: Deep book value discount, negative TTM P/E ratio, combined with high leverage, easy to trigger double discount pricing of “quality discount + valuation discount”
- Cycle and Demand Risk: High interest rates and slow growth restrict RevPAR recovery; stronger demand and pricing power are needed to repair profits
- Liability Structure: Floating-rate proportion, duration distribution, refinancing pace and hedging strategies
- Operational Quality: RevPAR/ADR/OCC trends, geographic location and brand synergy of property portfolios, cost control capabilities
- Dividends and Distributable Cash Flow: FFO per share, distribution coverage and sustainability (PEB’s specific dividend rate/FFO data not obtained in this round)
- Relative Valuation: P/FFO, P/B, EV/EBITDA, etc., relative to peers and own historical positions
- Scenario and Sensitivity: Stress test of net profit and distributable cash flow under different interest rate and occupancy rate scenarios
- Opportunities: If interest rates enter a downward channel, high-leverage but operationally improving targets have the greatest elasticity; leading REITs with strong brands and urban positioning lead valuation recovery
- Risks: High or rising interest rate cycles suppress refinancing and valuation; weakening demand combined with cost rigidity erodes profits; excessively high regional concentration increases volatility
- Individual Stock Level: For high-leverage/negative-profit hotel REITs (such as PEB), need to strictly evaluate refinancing schedules, interest rate hedging and operational improvement paths; before the interest rate inflection point is confirmed, maintaining underweight or wait-and-see is more prudent
- Sector Allocation: Priority should be given to leading hotel REITs with higher operational quality, healthy capital structure, and better valuation and dividend matching; after clear expectations of interest rate decline strengthen, gradually increase allocation to high-quality targets
- Risk Control Points: Set stop-loss/drawdown control, dynamically adjust positions and duration exposure based on macro and interest rate prospects, avoid overexposure during periods of refinancing peaks and weak demand
- [0] Gilin API Data (real-time quotes, company overview, financial analysis, technical analysis, market indices, DCF valuation)
- [1] Yahoo Finance — “3 Safer REITs That Could Raise Dividends in 2026” (used to understand the general positive logic of interest rate cuts for high-quality REITs)
- [2] Investopedia — “Understanding REITs: What They Are and Tips for …” (REIT basic knowledge framework)
- [3] Yahoo Finance — Several data pages on hotel REITs and industry trends (used for background understanding, such as Park Hotels & Resorts, industry trends, etc.)
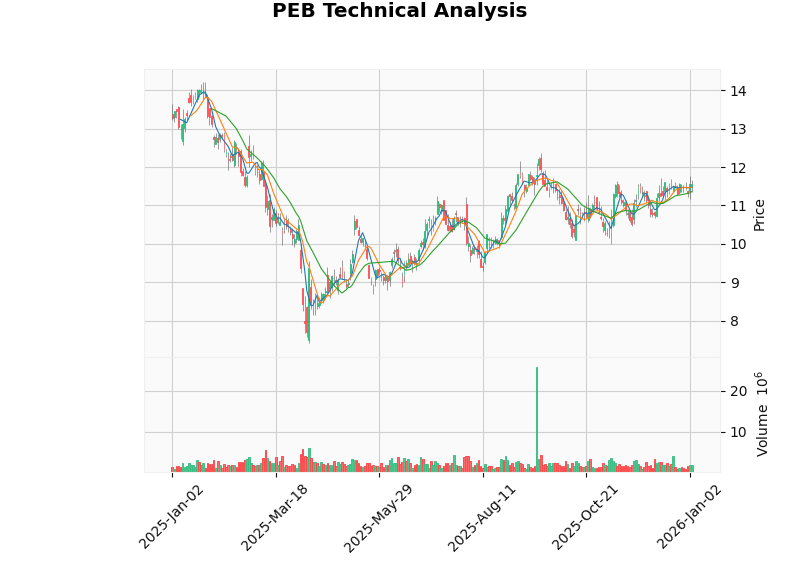
(Description: The chart above shows the price trend of PEB from January 1, 2025 to January 6, 2026; it is currently in a volatile range, with support and resistance around $11.36 and $11.73. Data source: Gilin Technical Analysis Tool [0].)
Insights are generated using AI models and historical data for informational purposes only. They do not constitute investment advice or recommendations. Past performance is not indicative of future results.
About us: Ginlix AI is the AI Investment Copilot powered by real data, bridging advanced AI with professional financial databases to provide verifiable, truth-based answers. Please use the chat box below to ask any financial question.